My Top 3 Bitcoin Bottom Indicators for Cycle Investors
Bitcoin is staging a mid-year relief rally in July 2026. We analyze the MVRV Z-Score, Bitcoin Timing Model, and Fear & Greed Index to show where we are in the cycle — and what cycle-based investors should do next.
Three On-Chain and Sentiment Indicators Reveal Where We Are in the Bitcoin Cycle — and What Cycle-Based Investors Should Do Next
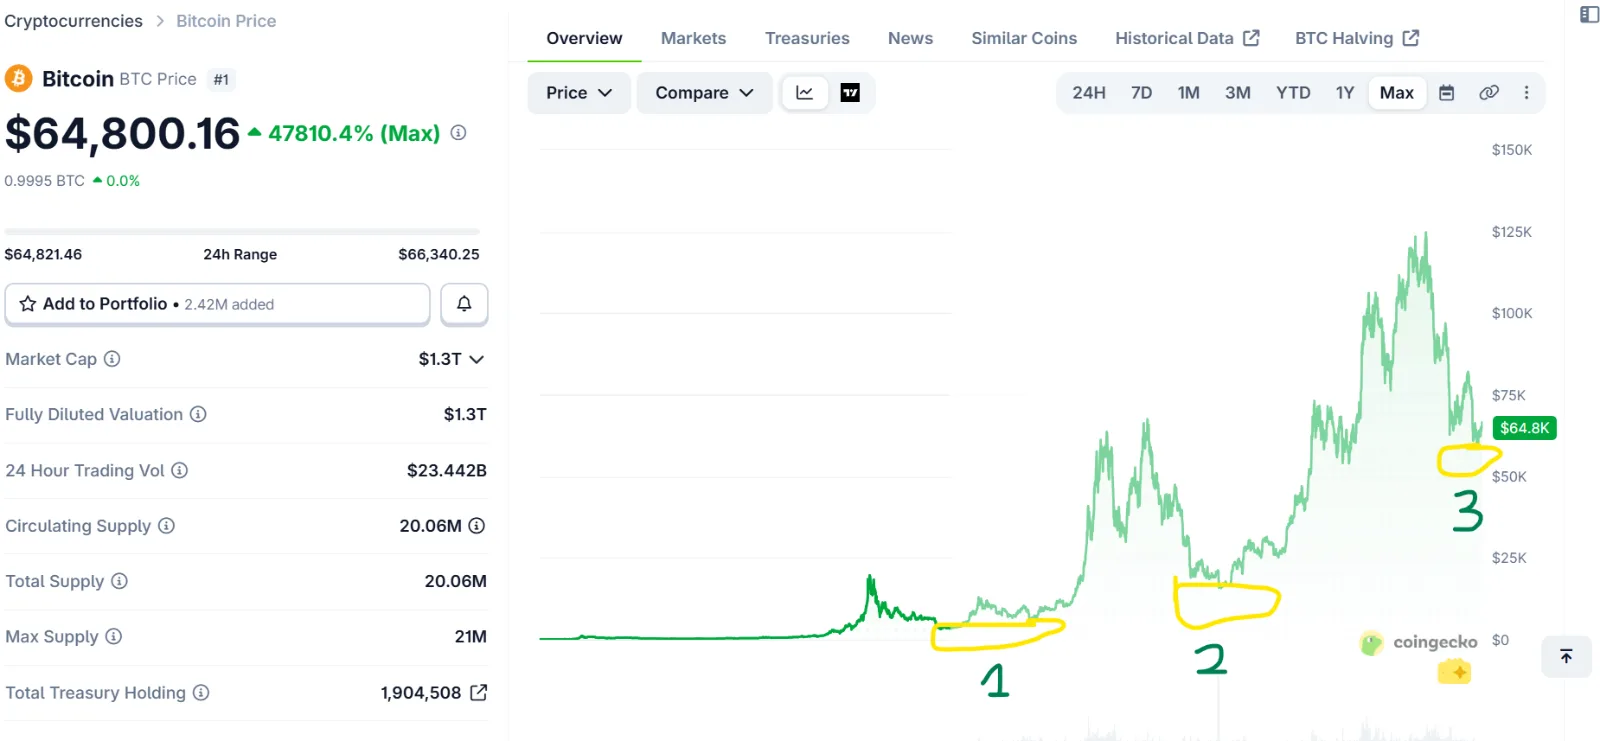
After a prolonged downtrend that stripped hope from retail investors who once believed that buying Bitcoin above $120,000 was a life-changing opportunity, a hint of excitement is returning to the cryptocurrency market. Now, the euphoria of late 2025 feels like a distant memory. And as Bitcoin shows signs of a mid-year recovery, most retail investors are now asking: Is this the real bottom, or just another trap?
In this update, we'll walk through three of the most reliable cycle indicators we track — the MVRV Z-Score, the Bitcoin Timing Model (BTM), and the Crypto Fear & Greed Index — to give you a clear, data-driven picture of where we stand in this bear market and how to position accordingly. Let's get started.
My Top 3 Bitcoin Bottom Indicators for Cycle Investors
1. The MVRV Z-Score: The Most Reliable Cycle Bottom Indicator
If you're a long-term Bitcoin investor and you're not tracking the MVRV Z-Score, you're navigating the cycle without one of the most powerful maps available to you. Let me explain what it is, why it matters, and where it currently stands.
What Is the MVRV Z-Score About?
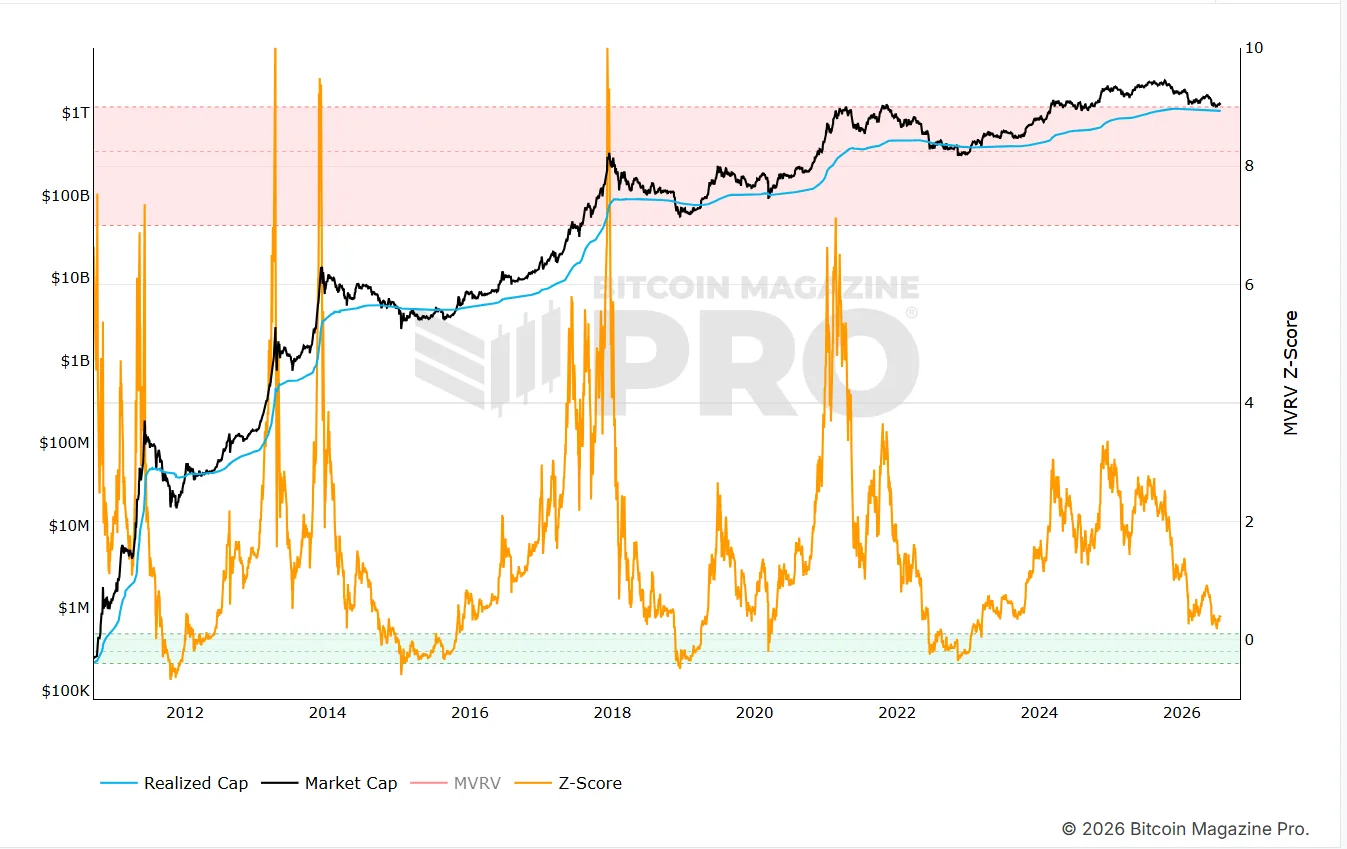
The MVRV Z-Score compares Bitcoin's Market Cap (the current market value of all Bitcoin in circulation) against its Realized Cap (the aggregate value of all Bitcoin at the price each coin last moved — essentially what investors actually paid for their Bitcoin on-chain). The gap between these two figures, expressed as a Z-Score, tells you whether Bitcoin is historically overvalued or undervalued relative to what the market actually paid for it.
When the Z-Score spikes into the red zone (above 7), it has historically signalled that Bitcoin is trading well above what investors paid — a strong sell signal. When it dips into the green zone (near or below 0), it means Bitcoin is trading near or below the aggregate cost basis of the entire market — the definition of a genuine accumulation opportunity.
Why It's Reliable
What makes the MVRV Z-Score so powerful for cycle-based investors is its consistency. Every major Bitcoin bottom in history — 2011, 2015, 2018-2019, and 2022 — has been accompanied by the Z-Score entering the green zone. These are the moments when the average investor is underwater on their Bitcoin position, fear is at its peak, and smart money quietly accumulates. The pattern has repeated across every full market cycle Bitcoin has lived through.
Its Limitations
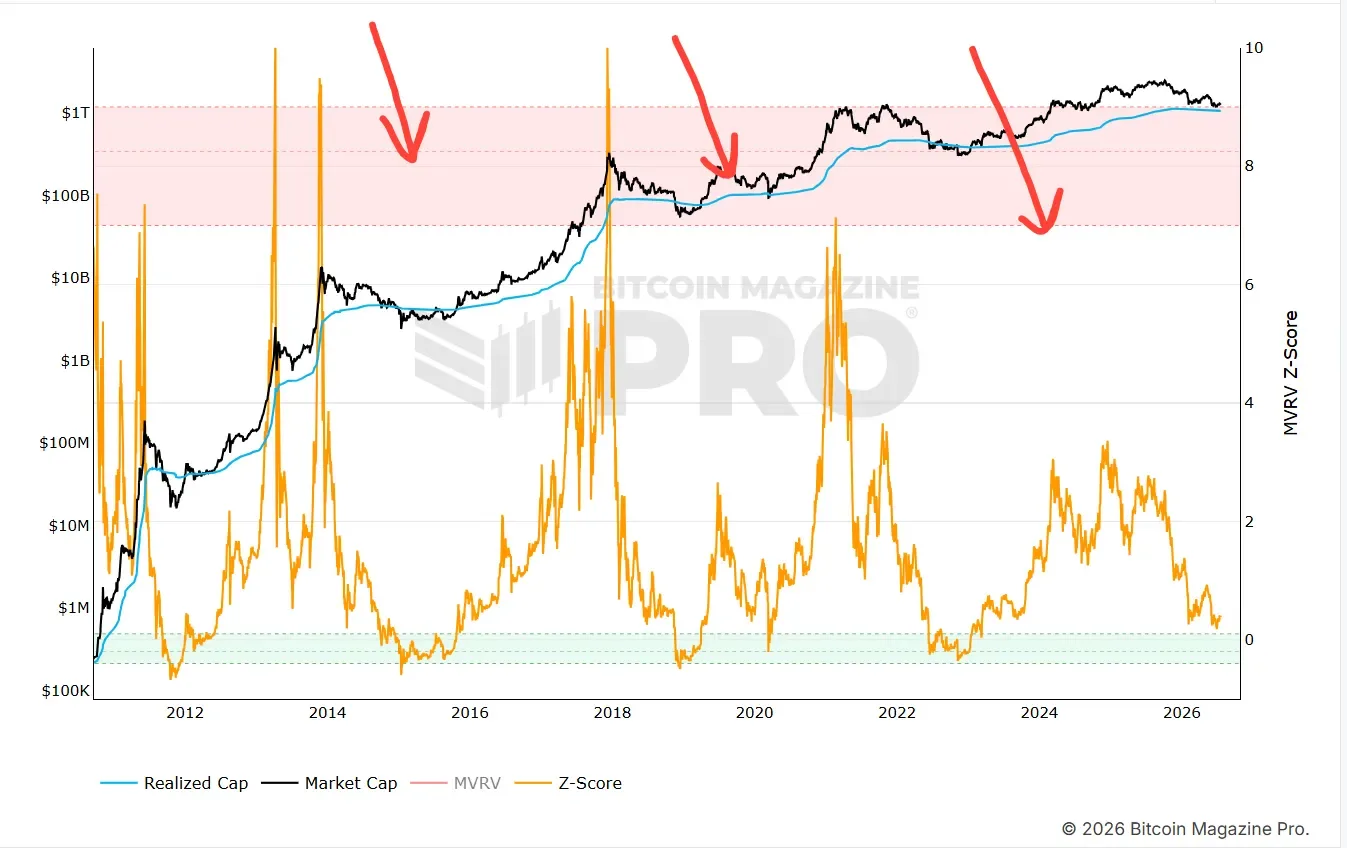
No indicator is perfect, and the MVRV Z-Score is no exception. One notable limitation visible in the chart is that during the 2024–2025 bull market, the Z-Score never reached the extreme peaks we saw in 2017 or 2021. The spike was more muted, which some analysts attribute to the maturation of the Bitcoin market, increased institutional participation, and greater distribution of supply. This means the sell signals from the Z-Score's red zone may be less dramatic going forward — though the green zone accumulation signal has held its historical significance. See the screenshot below.
Where We Are Now
Looking at the current MVRV Z-Score chart, the orange Z-Score line has pulled back significantly from its 2025 highs and is now approaching the lower boundary of the chart. See the green arrows in the chart below.
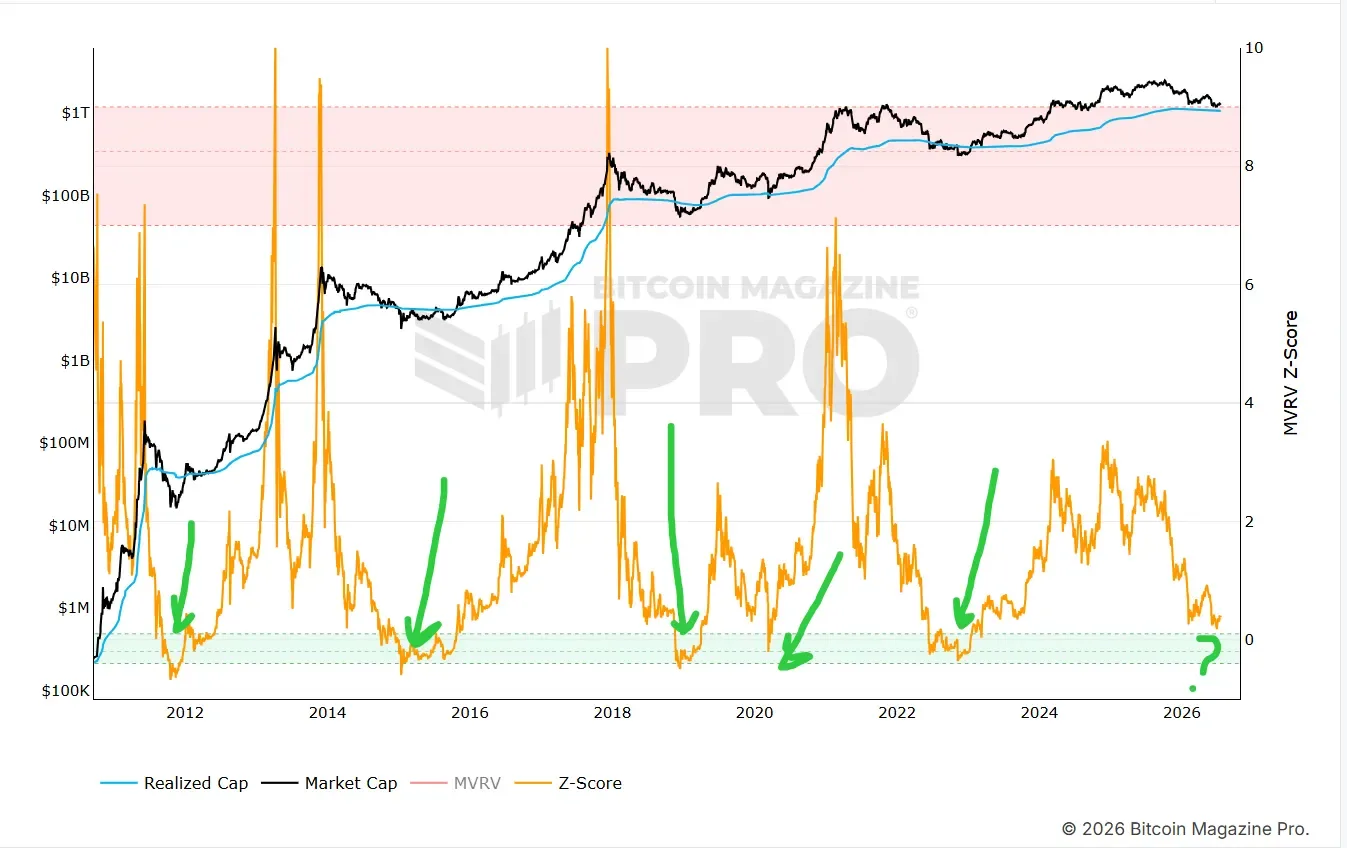
We are not yet in the green zone, but we are trending in that direction. This tells us we are in the right neighbourhood — but not necessarily at the maximum buying opportunity the Z-Score has historically flagged. The ideal buy zone is when the Z-Score dips into the green band near 0. We'll be watching for that signal closely.
You can track the live MVRV Z-Score at bitcoinmagazinepro.com/charts/mvrv-zscore
2. Bitcoin Timing Model: Sentiment Is Waking Up — and That's a Warning
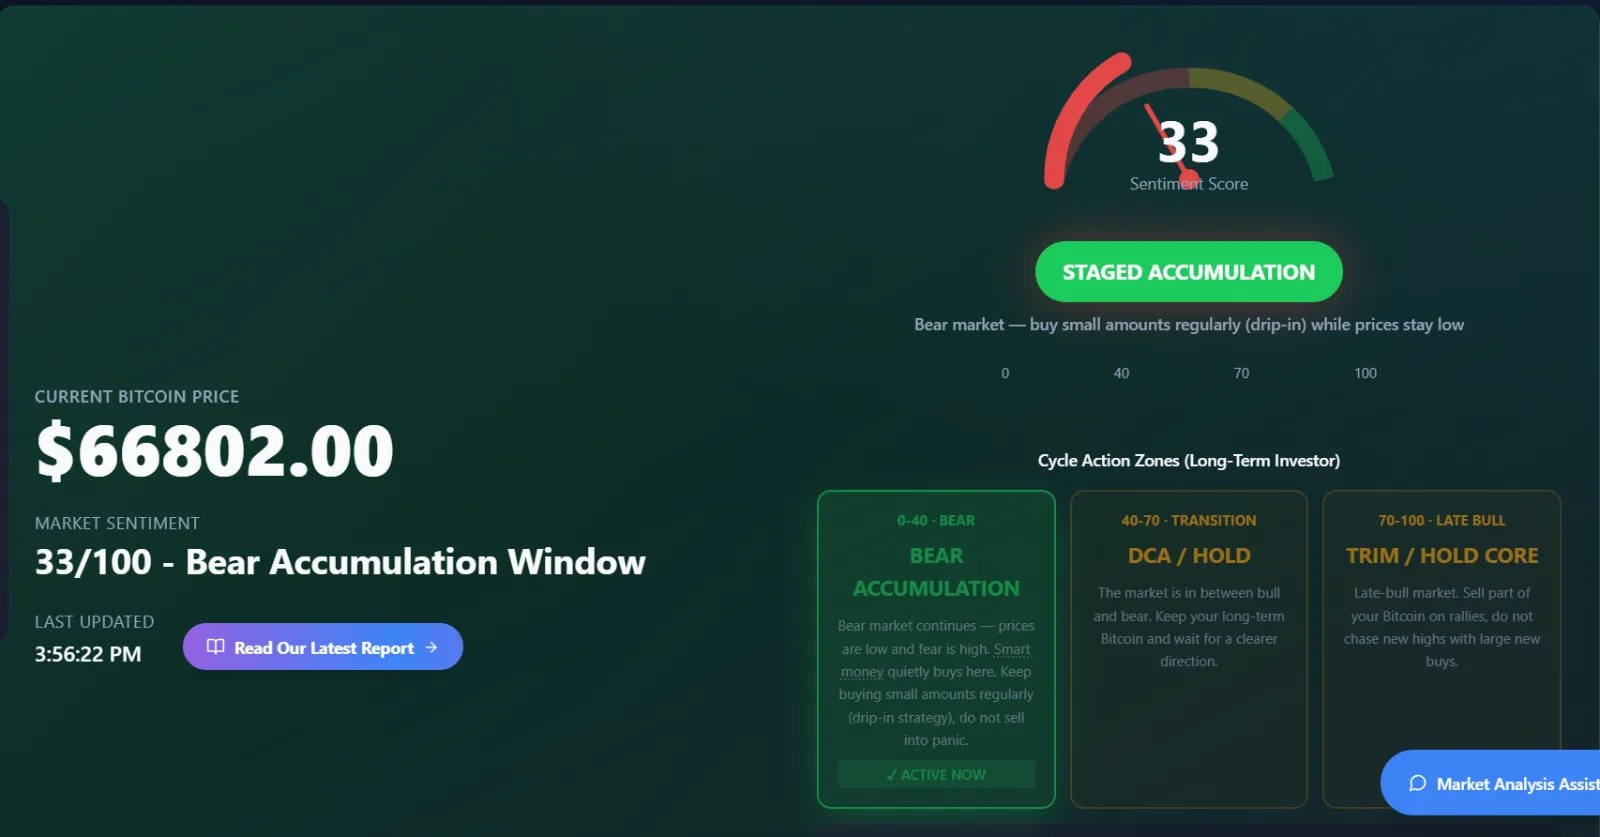
The Bitcoin Timing Model (BTM) is a proprietary sentiment and cycle tracking tool that scores the current market phase on a 0–100 scale across three action zones: Bear Accumulation (0–40), DCA/Hold Transition (40–70), and Late Bull Trim/Hold (70–100).
As of the latest reading, the BTM score has risen to 33/100, placing us firmly in the Bear Accumulation Window — up from just 19% recorded at the start of July 2026. The model's current signal: Staged Accumulation — buy small amounts regularly (drip-in) while prices stay low.
Here's what that movement tells us.
The Signal
The best buying opportunities we've tracked using this model have historically appeared when the sentiment score falls below 20%. The most aggressive accumulation windows have materialized when the score dips below 10% — the maximum fear zone where long-term investors deploying capital have historically been rewarded most generously.
We touched those levels in the early weeks of July, when the BTM sat at 19%. That was the signal to begin staged accumulation — and if you acted on it, you're already ahead of the curve.
The Caution Flag
Here's the nuance that matters right now: the BTM score climbing from 19% to 33% is a sign that sentiment is warming up. Euphoria is gradually returning. And historically, as sentiment recovers off the lows, the easy money has already been made. The risk of chasing a rising score is that you arrive late, just in time for the next pullback.
The Smart Money Analysis from the BTM adds important context: with an Accumulation Probability of 47%, a Distribution Probability of 20%, and a Trend Confidence of just 27%, the model is telling us we're in a neutral-to-transitional phase. The probability leans toward continued accumulation — but conviction is not yet high. This is consistent with a mid-year relief rally within a broader bear market, not a confirmed trend reversal.
You can track the live BTM score at bitcointimingmodel.com
Want to know the exact price zones, altcoin targets, and cycle timing we're working with for the 2027–2029 bull market? Our Golden Buy Zone Blueprint maps out every accumulation level we're targeting for Bitcoin, Ethereum, Solana, XRP, and other top assets — including the specific criteria to watch before deploying capital aggressively. [Access the Golden Buy Zone Blueprint →]
3. The Fear & Greed Index: Extreme Fear Is the Contrarian's Best Friend
The Crypto Fear & Greed Index (published by alternative.me) condenses the overall sentiment of the Bitcoin market into a single number between 0 and 100, drawing on six data inputs: volatility, market momentum and volume, social media sentiment, Bitcoin dominance, and Google Trends data.
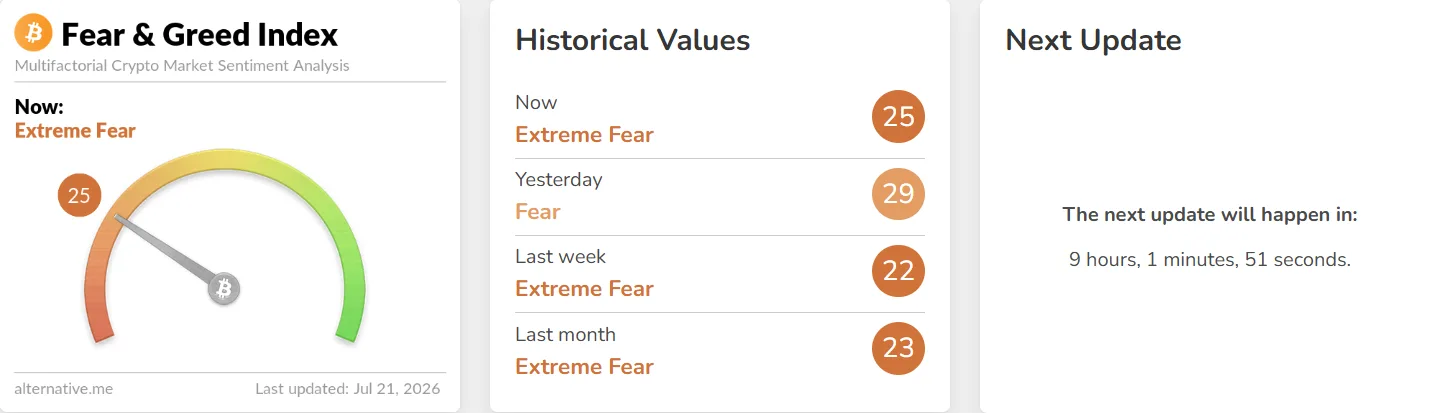
As of July 21, 2026, the index reads 25 — Extreme Fear.
Here's the historical context: a score of 25 means the market is in a state of deep anxiety. Investors are de-risking, selling into strength, and consuming negative headlines. The index was at 22 just last week, and 23 a month ago — sustained Extreme Fear territory for the better part of the past several weeks.
Why This Matters for Long-Term Investors
The "Extreme Fear" phase is historically considered one of the strongest accumulation signals, representing an extreme oversell condition and potential price capitulation. The index works best as a contrarian timing tool combined with other analysis — when the index shows extreme fear, it suggests investors are overly worried, potentially creating a buying opportunity. Dollar-cost averaging through extreme fear periods has historically produced the best risk-adjusted returns.
That is precisely the framework we apply here. When the Fear & Greed Index is screaming fear and the BTM score is below 20%, and the MVRV Z-Score is approaching the green zone — those three signals converging is not something you see often. We were close to that confluence in early July, and anyone who acted on it is better positioned today.
The Nuance
Extreme fear rarely marks a precise bottom, and historical behavior suggests fear phases tend to linger rather than reverse quickly. This is the important caveat. A reading of 25 on the Fear & Greed Index tells you sentiment is depressed — it does not tell you the price has bottomed or that a recovery is imminent tomorrow. That's why we use it as one input among several, not as a standalone signal.
The uptick from 22 (last week) to 25 (today) is a small but meaningful development. Sentiment is slowly thawing. The transition from Extreme Fear to Fear is the early stage of a market recovery in sentiment — and if history holds, price tends to follow sentiment as the cycle matures.
What Does All of This Mean for You?
Let's put the three indicators together and translate them into a clear framework:
The MVRV Z-Score tells us Bitcoin is below its historical average valuation — we're in fair-to-undervalued territory, approaching the green accumulation zone but not yet there at maximum historical depth.
The Bitcoin Timing Model at 33/100 tells us we're in the Bear Accumulation Window, but sentiment is warming up. The best staged accumulation windows appeared when the score was below 20%, and we've moved above that. This doesn't mean stop accumulating — it means be measured, not aggressive.
The Fear & Greed Index at 25 (Extreme Fear) confirms the broader market remains emotionally depressed, which is historically a favourable backdrop for patient long-term buyers — but not a signal to go all-in.
Taken together, the data is consistent with one conclusion: we are in a mid-year relief rally within a broader bear market. The opportunity for staged accumulation remains open, but the deepest fear readings — which have historically been the most rewarding entry points — may already be behind us for this particular wave. If the cycle follows its historical script, we could see another period of weakness and fear in September and Q4 before the cycle fully bottoms.
That means the strategy right now is clear: hold your current positions, continue DCA'ing into Bitcoin and top altcoins, and keep building cash on the sidelines for the possibility of another accumulation window later this year. Do not FOMO into the rally above $70,000–$75,000. That level will likely attract sellers and profit-takers, not the kind of buyers who sustain a trend reversal.
The 2027–2029 bull market is coming. But it rewards those who accumulate during the bear, not those who chase the early recovery.
Not sure exactly when and where to buy? The Golden Buy Zone Blueprint gives you the precise accumulation zones, timing signals, and cycle milestones we track for Bitcoin and the top altcoins heading into the next bull market. If you're serious about building a portfolio that performs, this is where it starts. [Get the Golden Buy Zone Blueprint →]
Final Thought
The mid-year rally is here. Sentiment is recovering. The charts are showing early signs of life. But the most dangerous move you can make right now is to confuse a relief rally with the end of the bear market.
Stay focused on the bigger picture. The indicators are telling you to accumulate steadily, build cash reserves, and remain patient for the deeper opportunity that the cycle may still offer. The investors who do that quietly, while the rest of the market reacts emotionally, are the ones who will look back at 2026 as the year they built the foundation for the next chapter of their financial lives.
Stay calm. Stay strategic. The real gains are still ahead.
— Jonas, Crypto Big Stories
Click Here to Access the Golden Buy Zone Blueprint!
This article is for educational purposes only and does not constitute financial advice. Always conduct your own research and manage risk responsibly. All on-chain data referenced is sourced from Bitcoin Magazine Pro and alternative.me.