XRP Price Prediction 2031: Can XRP Reach $100? What the Charts and Math Actually Say
Quick Answer: The consensus among data-driven analysts places XRP in the $6–$12 range by 2031 under moderate to optimistic conditions. A $100 XRP price target would require a market capitalisation of approximately $6.1 trillion — nearly three times the current size of the entire global cryptocurrency market. The cycle structure, the on-chain data, and the historical pattern all point to significantly lower — but still potentially highly profitable — price targets for patient, cycle-aware investors. Keep reading for the full breakdown.
Can XRP Really Reach $100?
Table of Contents
- What Is the XRP $100 Price Target — and Where Does It Come From?
- The Weekly Chart in 2026: What It's Actually Showing
- XRP's Most Consistent Historical Pattern: The Consolidation Cycle
- The Market Cap Math Nobody Wants to Run
- What Other Analysts Are Saying About XRP in 2031
- Realistic XRP Price Targets for 2028–2031
- When Is the Right Time to Buy XRP?
- Frequently Asked Questions
What Is the XRP $100 Price Target — and Where Does It Come From?
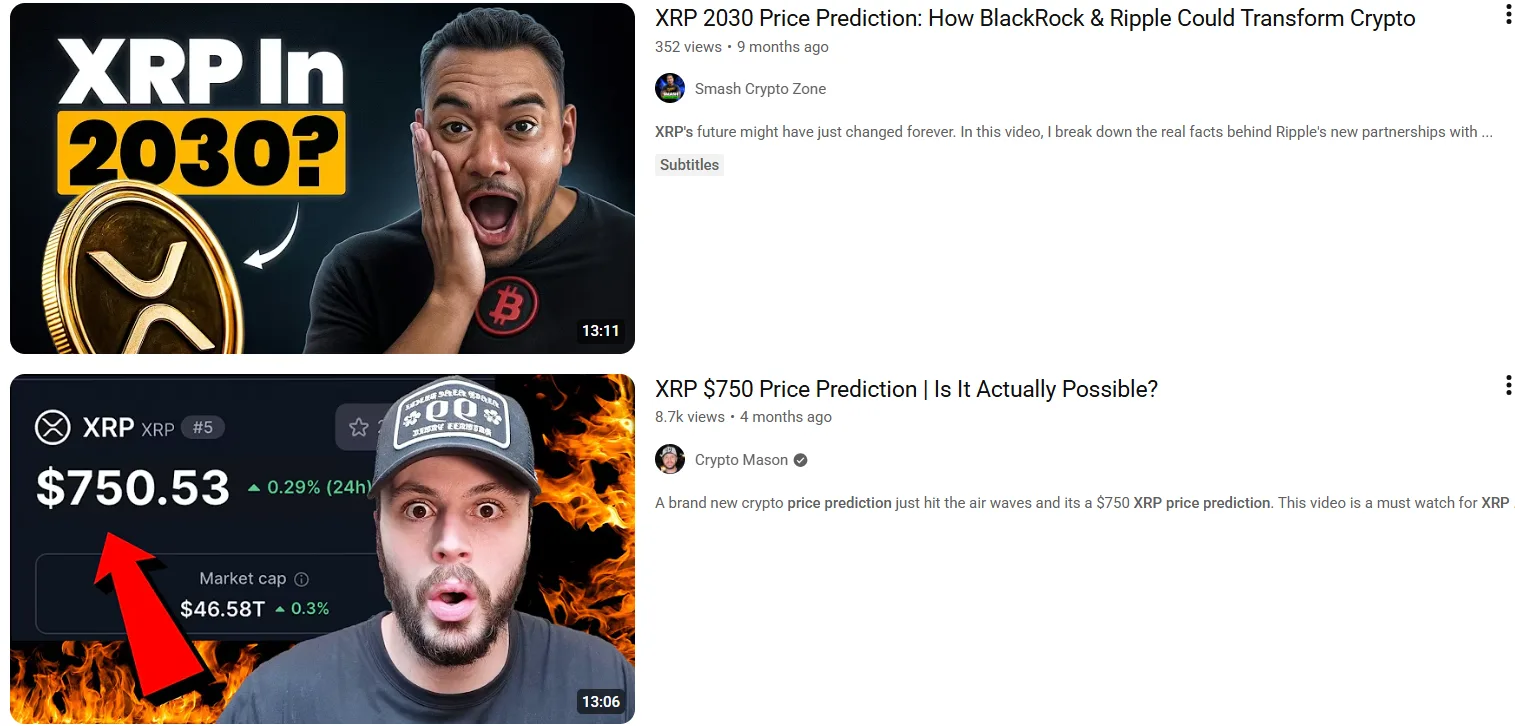
Search "XRP price prediction 2031" and you'll encounter two very different categories of content. The first category consists of data-driven analysts who model market cap growth, adoption rates, and historical cycle behaviour. The second consists of community influencers and social media accounts who publish $100, $500, and even $1,000 price targets with no supporting mathematical framework.
The $100 XRP prediction primarily originates from the second category. It circulates heavily within the XRP community on X (formerly Twitter), YouTube, and Telegram — driven by a combination of genuine enthusiasm for Ripple's cross-border payment technology and, in some cases, financial incentives to keep retail investors bullish and holding.
This article takes a different approach. We examine the XRP weekly chart, the historical cycle structure, the market cap mathematics, and the consensus among independent analysts to arrive at a data-grounded answer to the question everyone is asking: can XRP really reach $100 by 2031?
The XRP Weekly Chart in 2026: What It's Actually Showing
Before discussing long-term price targets, it's essential to understand where XRP currently sits in its market cycle — because the weekly chart tells a story that most price prediction articles completely ignore.
The trendline break: As of early August 2026, XRP/USD has broken above the descending trendline that has acted as resistance since XRP peaked above $3.65 in July 2025. This is a technically meaningful development. However, a trendline break during a bear market frequently produces short-term relief rallies before the broader downtrend reasserts itself. A single trendline break does not confirm a bull market reversal.
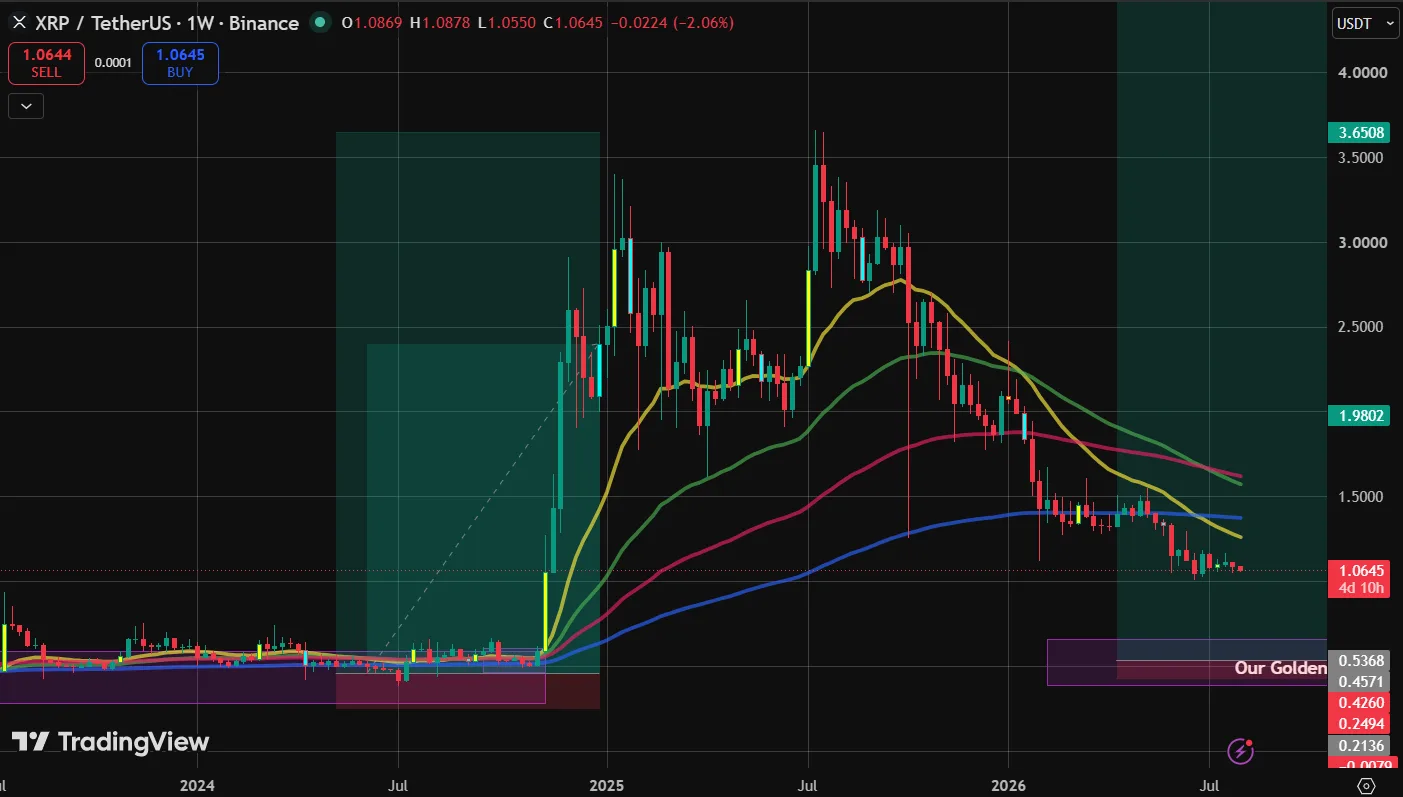
The EMA crossover: The more significant development on the XRP weekly chart is the confirmed bearish crossover of the 20-week EMA below the 200-week EMA. This is not a projected crossover — it has already occurred. In technical analysis, this configuration signals a prolonged downtrend is in place. The same crossover occurred during the 2022 XRP bear market and preceded months of sideways grinding before any meaningful recovery began.
Current price action: XRP is trading at approximately $1.06, below all key moving averages on the weekly chart. The EMA ribbon is stacked in a fully bearish configuration — shorter-term EMAs below longer-term ones, all sloping downward. XRP bulls are defending the $1.00 psychological support level, but the structural signals above that level are entirely bearish.
What this means for 2031 price targets: An asset in a confirmed weekly bearish EMA structure does not move directly to new all-time highs. It first needs to complete its bear market cycle — which, historically for XRP, means entering and completing a prolonged consolidation phase before the next explosive move begins.
XRP's Most Consistent Historical Pattern: The Consolidation Cycle
This is the single most important concept for any XRP investor to understand — and the one that the $100 prediction crowd consistently ignores.
XRP does not move in a straight line from bear market bottom to new all-time high. It follows a specific, historically repeatable four-step cycle:
Step 1: Explosive bull run to a new all-time high. Step 2: Sharp crash from the peak. Step 3: A prolonged consolidation phase (accumulation), lasting 18 months to 3 years. Step 4: A breakout from the consolidation zone, leading to the next explosive rally.
This pattern has repeated across every major XRP cycle: You can learn more inside the Golden Buy Zone Blueprint.
The 2014–2016 Accumulation Phase
After XRP's early price spike, it entered a deep, multi-year consolidation that lasted from approximately 2014 through 2016. During this period, XRP traded in a nearly flat band between $0.005 and $0.02 for roughly two years. Investors who accumulated during this phase and held into the 2017 bull run captured extraordinary gains — not those who bought after the rally had already begun. For context: XRP has risen 39,512% from its all-time low of $0.002686. That gain was made over a decade and across multiple cycles, not in one move.
The 2018–2020 Accumulation Phase
After the 2017–2018 peak near $3.00, XRP crashed and entered a two-year accumulation phase, where price remained trapped between approximately $0.56 and $0.13. This phase lasted from 2018 to 2020. Investors who DCA'd through that range and held into the 2021 bull market captured returns of 1,000% or more from their average cost basis.
The 2022–2024 Accumulation Phase (890 Days)
After the 2021 peak, XRP entered its most recent prolonged consolidation — spending approximately 890 days in a tight accumulation range before breaking out explosively in mid-2024 and eventually reaching its 2025 all-time high above $3.65. The ideal entry windows during that phase were flagged by on-chain and cycle-aware analysts months before the breakout occurred.
Where Are We Now?
The current 2026 setup does not yet show the hallmarks of a completed consolidation phase. XRP has been in an active downtrend since July 2025. No extended sideways base has formed. According to the cycle thesis, the consolidation phase that precedes the next explosive move is likely still ahead — not behind — us.
The implication: Buying XRP above $1.00 before the consolidation base has formed is buying into an active downtrend, not into an accumulation zone. The historical pattern suggests significantly lower prices are possible before the genuine buying opportunity arrives.
The Market Cap Math Nobody Wants to Run
Let's address the $100 XRP price target with the most straightforward test available: the market capitalisation calculation.
XRP's current circulating supply is approximately 61–62 billion tokens.
At $100 per XRP, the asset's market capitalisation would reach approximately $6.1 trillion. To contextualise that figure:
- The entire global cryptocurrency market currently has a total market cap of less than $2.3 trillion. A $100 XRP alone would need to be nearly three times larger than every cryptocurrency combined today.
- The global gold market — the world's most established store of value with thousands of years of history — has a total market cap of roughly $18 trillion. A $100 XRP would represent more than a third of gold's total value.
- The US GDP is approximately $27 trillion. XRP at $100 would represent nearly a quarter of the entire annual economic output of the world's largest economy.
The question is not whether XRP has utility. Ripple's cross-border payment technology has genuine real-world applications, growing institutional adoption, and a strong development track record. The question is whether that utility can justify a $6.1 trillion market cap within five years — while the broader crypto market currently sits below $2.3 trillion.
XRP may not reach $100 in the near future, and while some analysts remain bullish on the long-term case, the math of such a target requires extraordinary conditions that current market dynamics do not support.
What Other Analysts Are Saying About XRP in 2031
To provide a balanced view, here is what independent analysts and financial data sources currently project for XRP by 2031:
When analysts blend the probabilities across moderate, optimistic, and pessimistic scenarios, the consensus estimate centres on a 2031 price near $7.90. Under moderate assumptions regarding adoption and market growth, projections place XRP in a trading range between $5 and $8 by 2031.
More bullish projections suggest XRP could reach $8–$12 by December 2029, with 2031 potentially representing a consolidation following previous gains — particularly if XRP rallies in the 12–18 months following the April 2028 Bitcoin halving
The maximum forecasted price target from mainstream prediction models for 2031 is in the $6.92–$7.90 range, with average expected trading prices around $6.48–$7.90 depending on the model.
Notably, not a single credible independent analyst with a published, mathematically grounded methodology is forecasting $100 XRP by 2031. The $100 target exists in community sentiment, not in modelled analysis. Click here to download the Golden Buy Zone Blueprint to master the cycle-bottom thesis.
Realistic XRP Price Targets for 2028–2031
Based on the cycle thesis, historical accumulation patterns, and independent analyst consensus, here are the price scenarios we consider realistic:
Conservative scenario (2028–2031): $6–$8. This assumes Bitcoin leads a moderate bull market following the 2028 halving, XRP completes its accumulation phase and participates in the broader altcoin season, and no extraordinary adoption catalyst occurs.
Moderate scenario (2028–2031): $8–$12. This assumes stronger-than-expected institutional adoption of the XRP Ledger, continued Ripple partnership expansion, and a strong Bitcoin bull market that drives capital rotation into major altcoins.
Optimistic scenario (2028–2031): $12–$25. This assumes XRP Ledger achieves significant traction as a global settlement and institutional payments network, regulatory clarity accelerates institutional participation, and crypto market cap expands substantially above $5 trillion.
The $100 scenario: Not supported by current data, market cap mathematics, or any independently modelled price framework available as of August 2026.
From our projected Golden Buy Zone between $0.42 and $0.54, even the conservative $6–$8 scenario represents returns of 1,000–1,500% — a genuinely compelling long-term investment thesis that requires no hallucination about $100 prices.
When Is the Right Time to Buy XRP?
Based on the cycle history outlined above, the optimal XRP buying windows have always occurred during the prolonged consolidation phase — not during the bull run, and not during the active downtrend that precedes consolidation.
The signals to watch for before initiating or expanding an XRP position include:
Signal 1 — Bitcoin bottom confirmation: XRP does not lead the market out of a bear phase. Bitcoin must first confirm its cycle bottom by reclaiming and holding the 20-week EMA as support. Until that occurs, altcoins including XRP remain vulnerable to further downside.
Signal 2 — XRP consolidation base formation: Look for XRP to establish a multi-month sideways trading range with narrowing volatility — the same pattern visible in the 2014–2016, 2018–2020, and 2022–2024 accumulation phases. That base formation is the technical signal that smart money is accumulating. Learn more inside the Golden Buy Zone Blueprint.
Signal 3 — EMA reclamation: For a genuine trend reversal signal on XRP, the 20-week EMA needs to reclaim and hold above the 200-week EMA. The current bearish crossover must reverse before the structural picture turns constructive.
Frequently Asked Questions
Can XRP reach $100 by 2031? Based on market cap mathematics, the current XRP supply of ~61 billion tokens would place the total market cap at approximately $6.1 trillion at a $100 price — nearly three times the current total global cryptocurrency market. While not mathematically impossible over a very long horizon, this target is not supported by any independently modelled analysis available as of 2026.
What is a realistic XRP price target for 2031? Independent analyst consensus places XRP between $6 and $12 by 2031 under moderate to optimistic conditions, with a blended consensus estimate near $7.90. More bullish scenarios with strong institutional adoption could push toward $12–$25.
Is XRP a good investment in 2026? XRP is in an active bear market downtrend as of August 2026, trading below key weekly EMAs with a confirmed bearish EMA crossover. Cycle-based analysis suggests waiting for the consolidation phase to establish before initiating significant positions. The best XRP buying opportunities historically occur during its prolonged accumulation phases, not during active downtrends.
When did XRP last have a major accumulation phase? The most recent major XRP accumulation phase lasted approximately 890 days from 2022 to 2024, before XRP broke out and eventually reached its 2025 peak above $3.65. Prior accumulation phases occurred in 2014–2016 and 2018–2020.
What is the XRP Golden Buy Zone? Based on our cycle analysis, the XRP Golden Buy Zone — the price range where historical accumulation phases have offered the best risk-to-reward entry points — sits between approximately $0.42 and $0.54. From this zone, even conservative 2031 price targets of $6–$8 represent 1,000%+ returns.
What is XRP's all-time low? XRP's all-time low is $0.002686, set in 2014. From that price to its 2025 peak above $3.65, XRP rose approximately 135,900%. That gain was generated over more than a decade and across multiple full market cycles.
Conclusion: Dreams Are Fine — Hallucinations Are Expensive
XRP is a legitimate asset with real utility, a strong community, and a track record of delivering extraordinary returns to investors who understand when to buy and when to sell. The cycle structure is consistent. The pattern is readable. And the next significant buying opportunity is likely approaching — but probably not yet here.
The $100 price target is not a data-driven forecast. It is a narrative — one that benefits influencers, content creators, and anyone whose audience stays engaged by believing they are on the verge of life-changing gains. It does not benefit retail investors who buy into an active downtrend without a consolidation base, without Bitcoin confirming its recovery, and without the mathematical foundations to support such a valuation.
The realistic path to maximum XRP returns in this cycle runs through patience, not enthusiasm. It runs through the accumulation zone, not the $1.00 level during an active downtrend. And it ends — for those who execute it correctly — with substantial profits realised during the 2028–2029 euphoria phase, while the $100 crowd is still waiting for a target the math cannot support.
This article is for informational and educational purposes only and does not constitute financial advice. Cryptocurrency investing carries significant risk. Always conduct your own research and consult a qualified financial professional before making investment decisions.
For detailed XRP accumulation zones, entry criteria, and cycle timing models covering Bitcoin, Ethereum, XRP, Solana, and other assets — see the [Golden Buy Zone Blueprint →]