Bitcoin MVRV Z-Score Green Zone: Spot Macro Market Bottoms
Discover how the Bitcoin MVRV Z-Score uses standard deviation and aggregate investor cost basis (Realized Cap) to isolate macro bottoms, avoid emotional panic, and time generational entry zones.
Bitcoin MVRV Z-Score Green Zone: How to Identify Macro Market Bottoms
Understanding when Bitcoin reaches a macro market bottom is the single most valuable edge you can have over others in this market. While emotional trading leads most investors to sell at the absolute trough out of fear, on-chain valuation metrics eliminate guesswork by quantifying investor behavior on the blockchain.
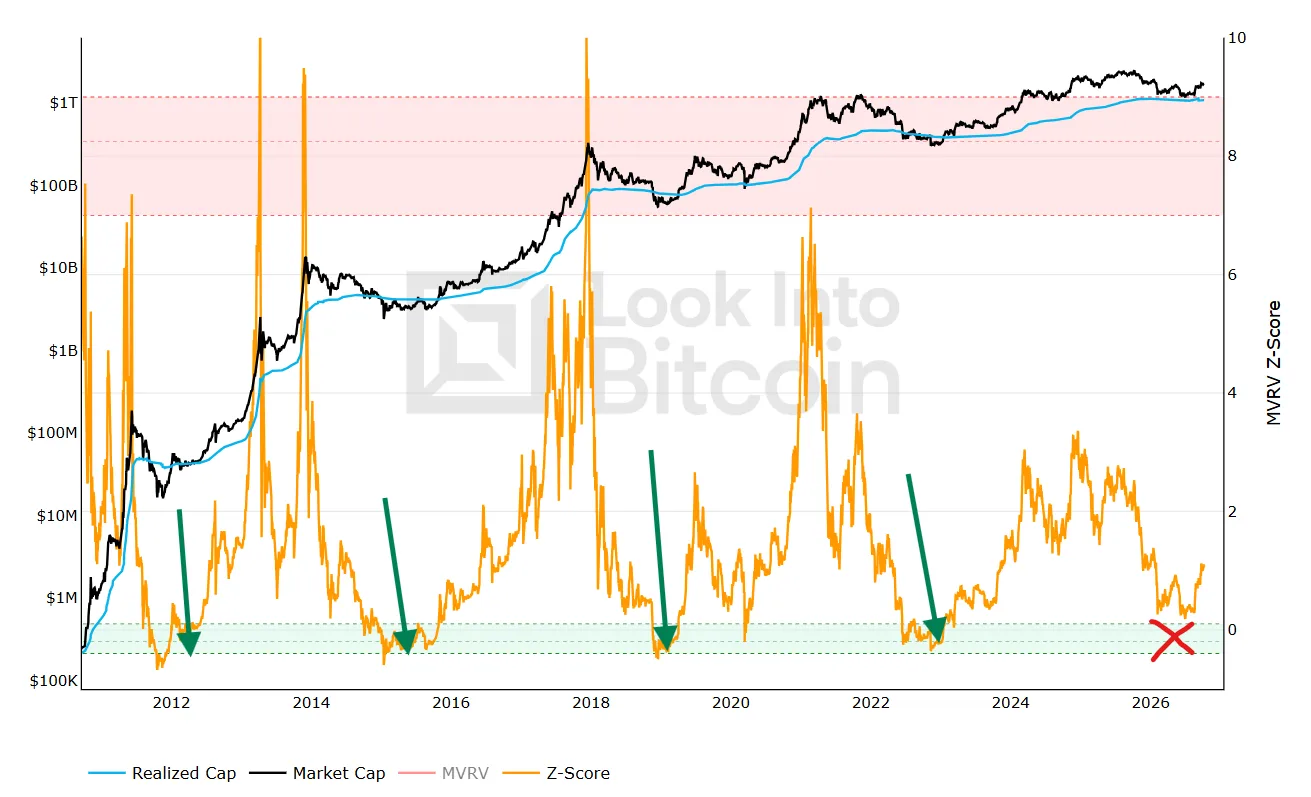
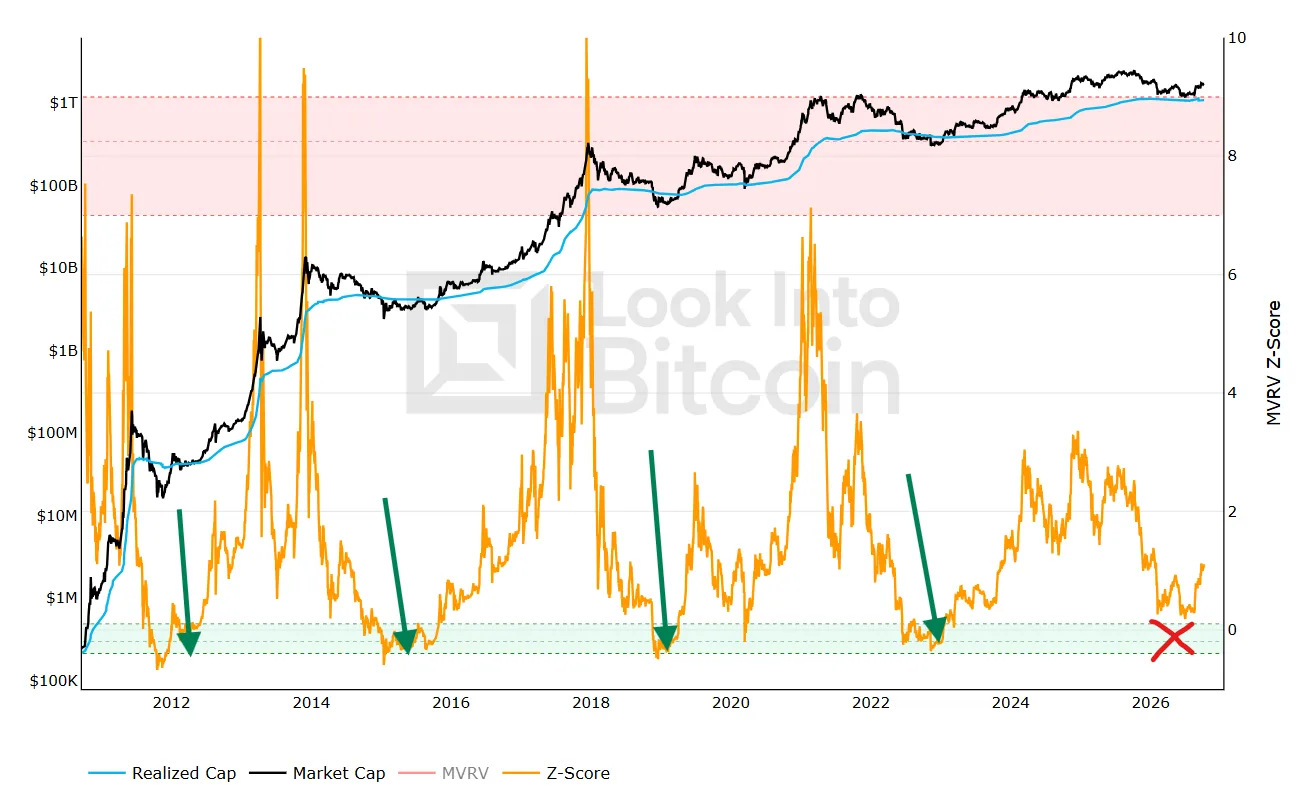
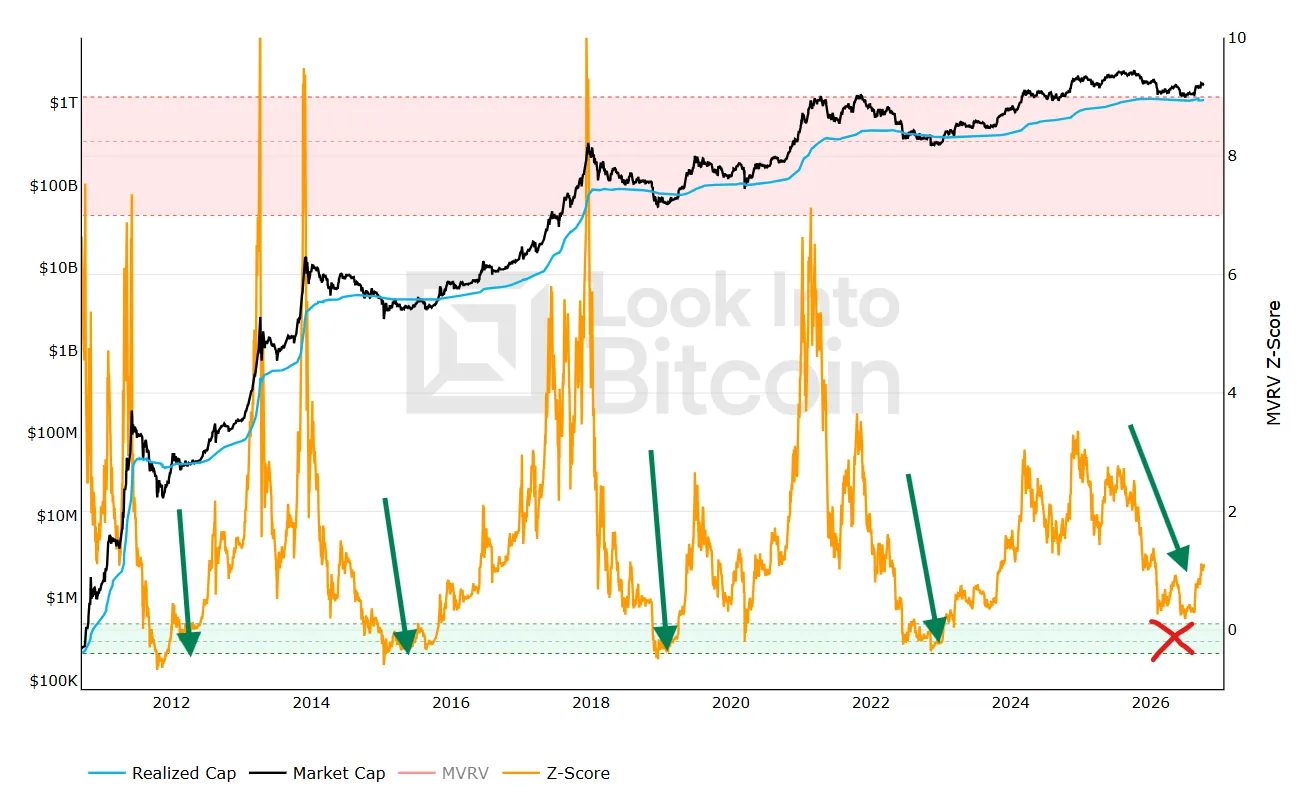
Among all on-chain bottom indicators, one metric consistently isolates macro bottoms with surgical precision: the Bitcoin MVRV Z-Score Green Zone. See the chart below.
In this guide, we break down what the MVRV Z-Score is, how the Green Zone works, why standard deviation matters for historical comparisons, and how to use this metric alongside complementary on-chain indicators to time generational accumulation zones.
1. Executive Summary: What is the MVRV Z-Score Green Zone?
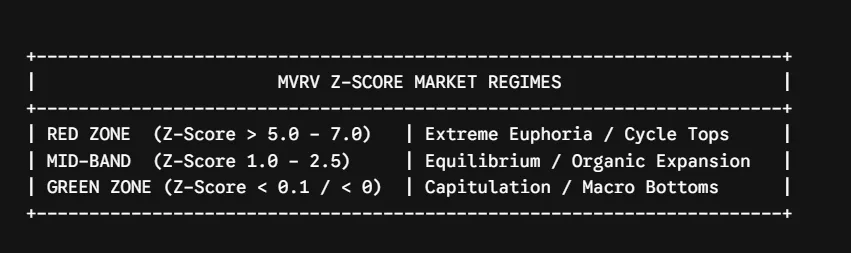
The Bitcoin MVRV Z-Score is an on-chain valuation metric that measures the deviation between Bitcoin’s Market Capitalization and its Realized Capitalization using standard deviation. The Green Zone (historically defined as a Z-Score below 0.10 or into negative territory) represents periods where Bitcoin trades near or below its aggregate investor cost basis. Historically, entering the Green Zone signals absolute market capitulation and generational value accumulation. But in this cycle, things seem to have changed. This time, Bitcoin didn't dip into the green zone, yet the price is already surging. Does that mean the MVRV Z-Score has been invalidated?
2. What is the Bitcoin MVRV Z-Score?
To understand the MVRV Z-Score, you must first break down the two core variables that power it: Market Capitalization and Realized Capitalization.
Market Cap vs. Realized Cap: Finding "Fair Value"
Market Capitalization (Spot Price × Circulating Supply): The current market value of the Bitcoin network. It fluctuates widely based on short-term exchange liquidity and speculative sentiment.
Realized Capitalization (Aggregate Cost Basis): Instead of valuing all coins at the current spot price, Realized Cap values each coin at the price it was last moved on the blockchain. This serves as the market’s aggregate breakeven cost basis—the true monetary energy invested in Bitcoin over time.
MVRV Ratio vs. MVRV Z-Score: Why Standard Deviation Matters
The raw MVRV Ratio is calculated simply as:
MVRV Ratio=Realized Capitalization/Market Capitalization
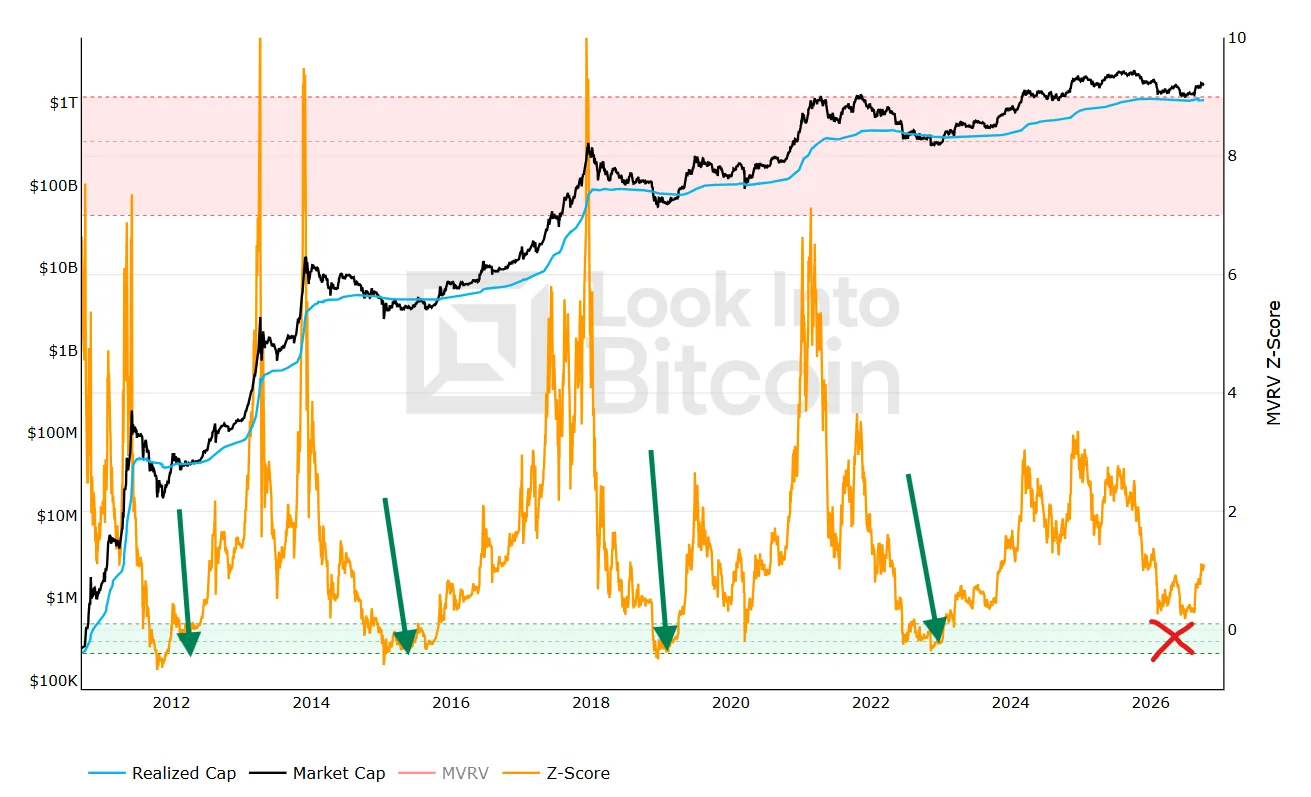
While useful, the raw ratio does not account for Bitcoin’s massive growth in total market size across multiple 4-year halving cycles. Comparing a $10 billion market cap in 2012 to a $1.5 trillion market cap in mature cycles introduces a mathematical scaling bias. See the green arrows on the chart below.
The MVRV Z-Score solves this problem by using standard deviation (σ) to pull out extreme speculative noise and normalize data across all market cycles:
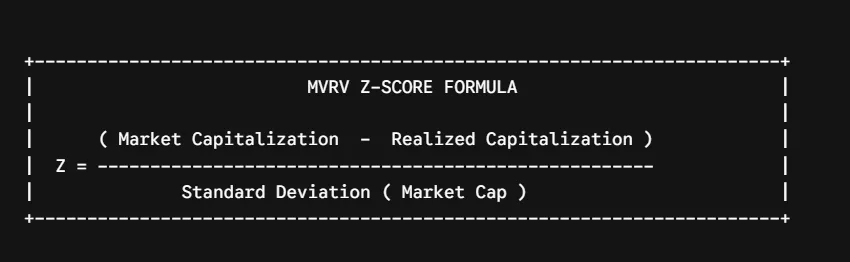
MVRV Z-Score= (Market Capitalization−Realized Capitalization)/ σMarket Capitalization
By dividing the difference between Market Cap and Realized Cap by the historical standard deviation of Market Cap, the Z-Score indicates how many standard deviations the spot price has deviated above or below Bitcoin's aggregate fair value.
3. Demystifying the MVRV Z-Score Green Zone
On an MVRV Z-Score chart, historical readings are visually segmented into distinct valuation bands:
What Triggers a Green Zone Entry?
A Green Zone entry occurs during deep bear market capitulation events. When the spot price plunges below the aggregate Realized Price (the average purchase price of all active coins), the network as a whole enters a net unrealized loss position.
Panic selling by short-term holders transfers supply to high-conviction long-term holders at a steep discount. Once panic selling exhausts itself, the MVRV Z-Score bottoms out in the Green Zone, creating a macro floor.
4. Historical Proof: How MVRV Z-Score Called Past Cycle Bottoms
Every major bear market trough in Bitcoin’s history has been marked by an MVRV Z-Score falling into or below the Green Zone boundary, but the 2026 bear market has so far failed to enter the Green Zone boundary of the MVRV Z-Score. See the (X) on the chart above.
(Data source reference: Glassnode, LookIntoBitcoin historical datasets)
Key Historical Takeaways
Sustained Green Zone Accumulation: Deep cycle bottoms (2015, 2018, and 2022) saw the MVRV Z-Score remain inside or near the Green Zone for several weeks to months, giving disciplined investors ample time to build macro positions.
Investing.comFlash Drops vs. Structural Bottoms: Exogenous liquidity shocks (such as March 2020) cause brief, sharp retests of the Green Zone upper boundary (0.0−0.1) before rapidly rebounding as institutional liquidity steps in.
5. The Institutional Shift: Structural Recalibration of On-Chain Metrics
As Bitcoin matures into a mainstream macro asset class—backed by global institutional ETF flows, corporate treasury allocations, and sovereign interest—on-chain metrics naturally evolve.
Elevated Realized Price Floors
Historically, retail-dominated bear markets forced spot prices well below Realized Price to achieve final market clearing. However, structural institutional allocations create a much higher and stickier cost-basis floor.
In recent market cycles, institutional buyers (such as ETF issuers and treasury desks) consistently stepped in near aggregate cost-basis levels. As a result, modern macro bottoms may form in the upper band of the Green Zone (0.10−0.30) rather than plunging to the deep negative readings seen in early, illiquid eras. See the last arrow on the chart below.
6. How to Accumulate Using the MVRV Z-Score
Trying to catch the exact tick of a macro market bottom is nearly impossible. Instead, technical analysts and long-term funds use the MVRV Z-Score as a scaled trigger for DCA (Dollar-Cost Averaging).
Signal Confluence: Pairing Indicators for Confirmation
Never rely on a single indicator in isolation. Combine the MVRV Z-Score with complementary macro signals to confirm a true cycle floor.
The Mayer Multiple (200-Day SMA Ratio): Cross-check whether the spot price is trading below 0.8×200-day SMA.
Short-Term Holder Cost Basis (STH-RP): Monitor for when the spot price reclaims the Short-Term Holder Realized Price after a deep drawdown. Reclaiming this level signals that recent buyers are back in profit and that momentum is shifting from distribution to trend continuation.
Puell Multiple: Look for miner revenue stress (Puell Multiple < 0.50), indicating that block reward revenue is historically depressed relative to its 365-day moving average.
7. Common Pitfalls & Limitations of On-Chain Metrics
Lost and Dormant Supply (Satoshi Coins): Millions of BTC mined in 2009–2010 have never moved on-chain. Because these early coins have a near-zero cost basis, they permanently pull down Realized Price, creating a slight structural baseline bias in raw calculations.
Lagging Realized Cap Changes: Realized Cap changes only when coins transact. During rapid capitulation wicks, the spot price moves much faster than Realized Cap can adjust, which can create brief metric lag during extreme market volatility.
Undervalued Does Not Mean "Instant Rally": An asset can remain fundamentally undervalued within the Green Zone for months. The Green Zone signals high structural value, not immediate short-term price timing.
8. Frequently Asked Questions (FAQ)
What is a good MVRV Z-Score to buy Bitcoin?
Historically, an MVRV Z-Score below 0.10 or entering negative territory marks generational accumulation zones. However, as the asset matures, scaling into spot allocations when the Z-Score falls within the 0.10−0.30 range offers strong long-term risk-adjusted entries.
What is the difference between MVRV Ratio and MVRV Z-Score?
The MVRV Ratio divides Market Cap by Realized Cap. The MVRV Z-Score subtracts Realized Cap from Market Cap and divides the result by the standard deviation of Market Cap. This standard deviation normalization enables accurate cycle-over-cycle comparisons regardless of market cap size.
Where can I track the live Bitcoin MVRV Z-Score?
Free on-chain analytics platforms such as LookIntoBitcoin, Glassnode, Bitbo, and CoinGlass publish updated daily MVRV Z-Score charts.
9. Conclusion: Adding the Green Zone to Your Strategy
The Bitcoin MVRV Z-Score Green Zone remains one of the most reliable on-chain indicators for identifying macro market bottoms. By filtering out short-term market noise and measuring the spot price relative to the aggregate market cost basis, it provides an objective framework for long-term capital allocation.
When the crowd is overwhelmed by bear market panic, tracking on-chain valuation metrics helps you act with clarity, scaling into long-term positions when risk is lowest and long-term upside potential is highest.
You can also use our proprietary tool, The Bitcoin Timing Model, to track the Bitcoin tops and Bottoms. Click here to visit the dashboard and check out today's reading.
Thanks for reading.
P.S. Need More Help and Resources?
Buy and sell crypto on Bybit, my preferred crypto exchange.
Download the Crypto Traders’ Handbook
Download Your AltSeason Blueprint
Upgrade Your Subscription to receive a copy of the BTM user’s guide.
Related Articles: