Candlestick Patterns for Crypto Trading | 6 Proven Setups Pro Traders Use Daily | BTM
Stop guessing what the market will do next. Learn the 6 best candlestick patterns for crypto trading that actually work, plus a high-win-rate strategy.
Candlestick Patterns for Crypto Trading | 6 Proven Setups Pro Traders Use Daily | BTM
Stop viewing crypto charts as confusing puzzles you can’t solve. Those red and green bars, called candlesticks, are actually a hidden "price map" that reveals the ongoing tug-of-war between buyers and sellers. Instead of seeing random lines, traders who understand Candlestick Patterns for Crypto Trading can actually sense the "mood" of the market in real-time.
And by mastering the six proven setups discussed in this article, you gain a significant advantage: you’ll know exactly when a price is about to skyrocket or crash before it happens. This strategy removes guesswork from your trades, helping you protect your money and identify the perfect moments to buy low and sell high—just like a pro.
Now, let's break down exactly how to read these powerful signals.
What are Candlesticks? (The Basics)
If you are a BTC-USD day trader, you cannot rely solely on a simple line chart. A line chart only shows the closing price, hiding all the important battles between buyers and sellers that occurred throughout the day.
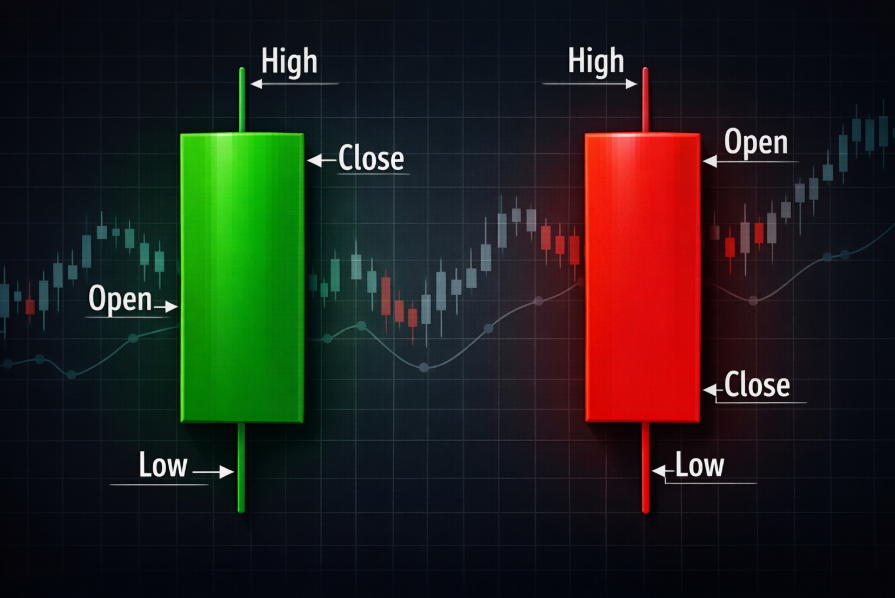
A candlestick chart gives you the full story. Each "candle" represents a specific amount of time (like 1 hour). It tells you four crucial pieces of information:
The Open: The price at the start of the hour.
The Close: The price at the end of the hour.
The High: The highest price during that hour.
The Low: The lowest price during that hour.
The Anatomy of a Candle
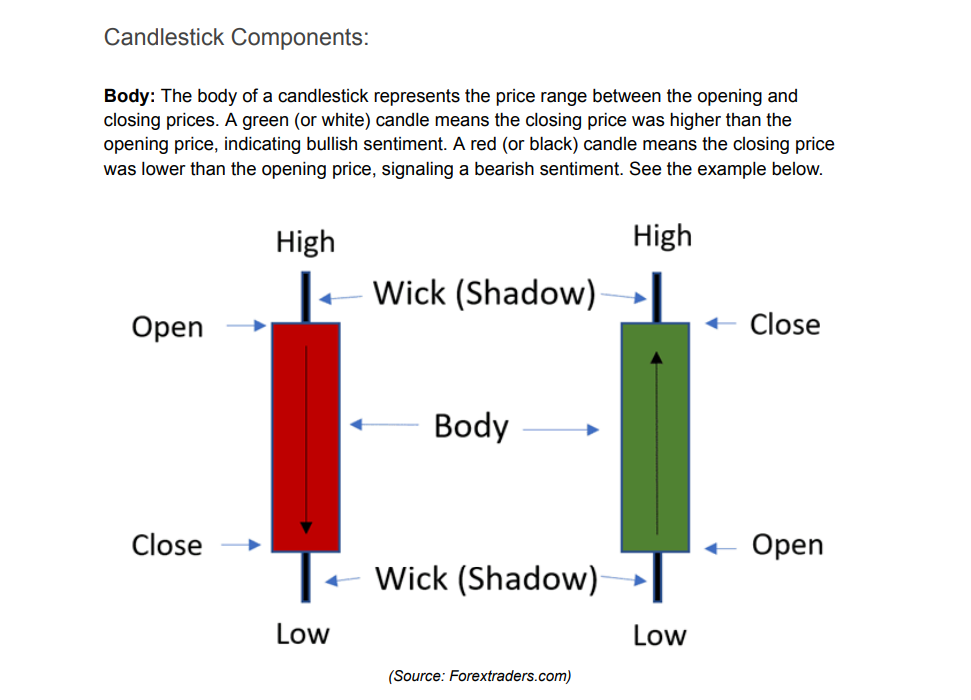
A candlestick has two main parts: the body (the thick colored area) and the wicks (the thin lines extending from the top and bottom).
Green Candle: This indicates that buyers won. The price closed higher than it opened.
Red Candle: This shows that sellers won. The price closed lower than it opened.
The size of the body shows who was in control. A large green body means buyers completely overwhelmed the sellers. And a large red body indicates sellers had full control.
The wicks tell you about rejection. A long wick on the bottom of a candle means sellers tried to push the price down, but buyers stepped in and rejected the move, pushing it back up.
Now that you understand how to read the language of the market, let's explore the 6 patterns that really generate profit.
The Top 6 Candlestick Patterns That Actually Work
Forget the textbooks that teach 50 different patterns. 99% of them are useless. Focus your attention entirely on these six proven setups.
1. The Engulfing Pattern
This is a two-candle pattern that signals a massive shift in power.
Bullish Engulfing: A small red candle is followed immediately by a giant green candle. The green body must completely "cover" or engulf the red body. It means buyers have completely taken over.
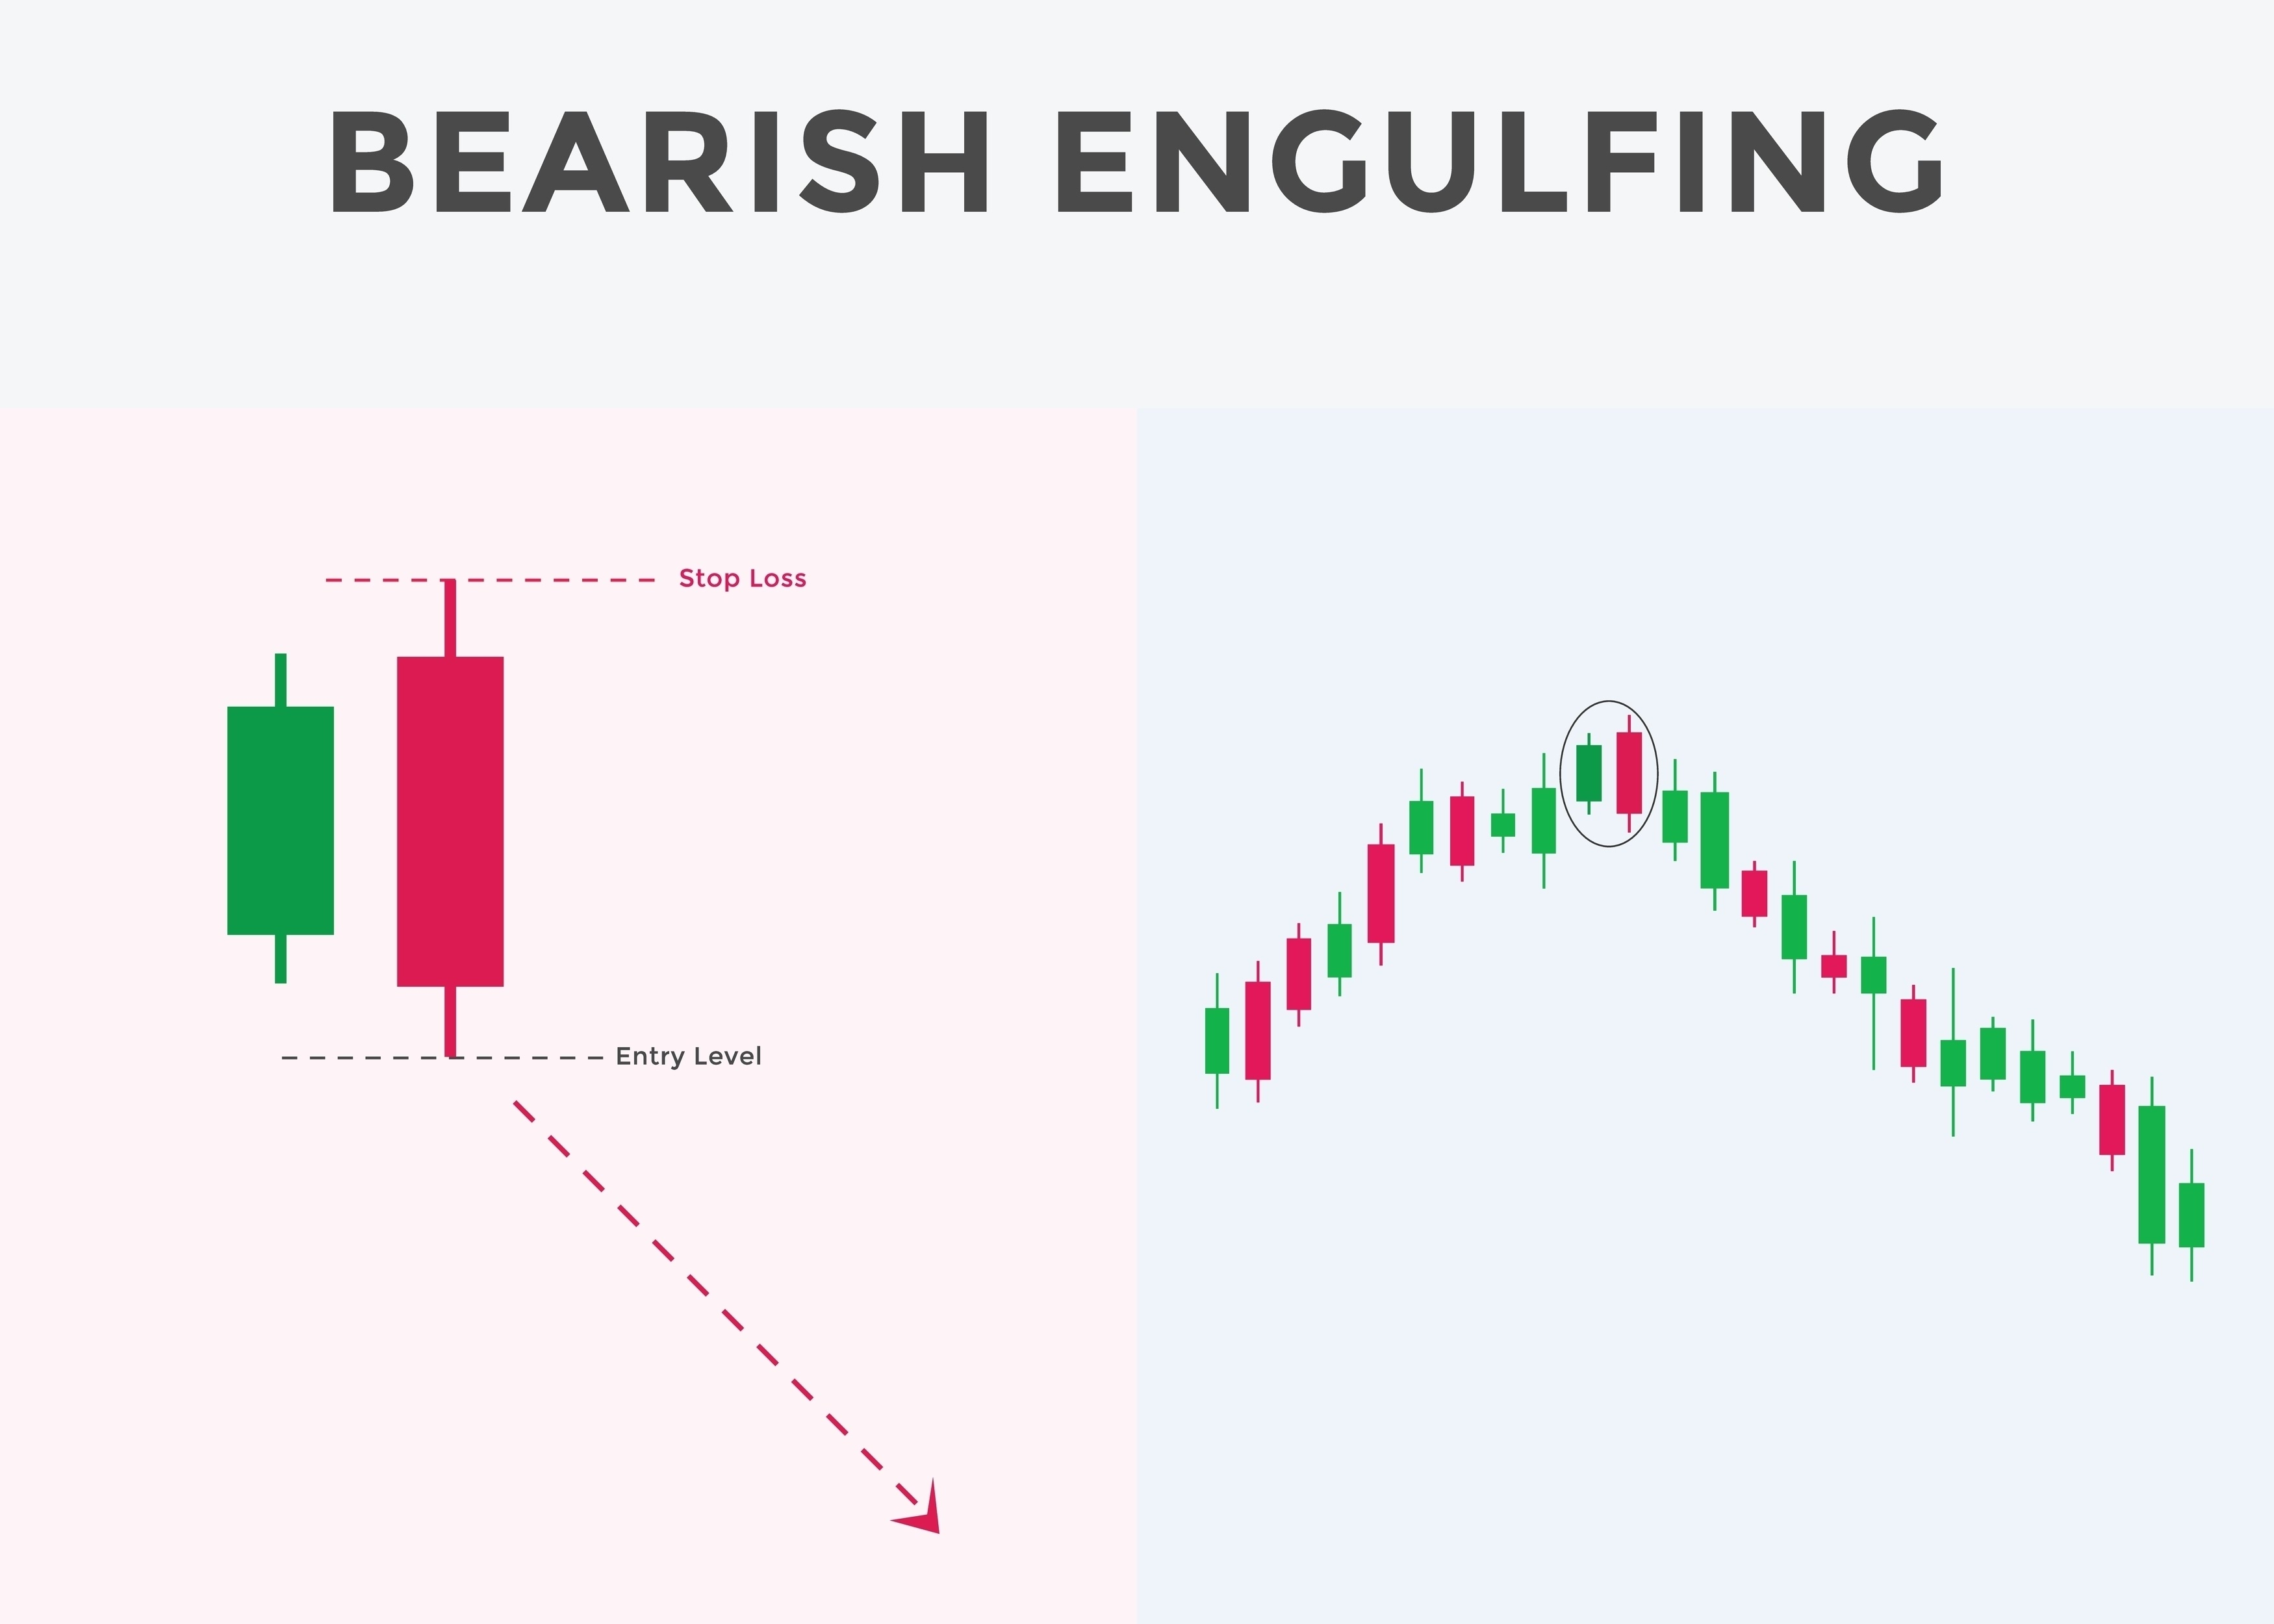
Bearish Engulfing: A small green candle is followed by a giant red candle that completely covers it. Sellers are now in charge. See the example below.
2. The Pin Bar
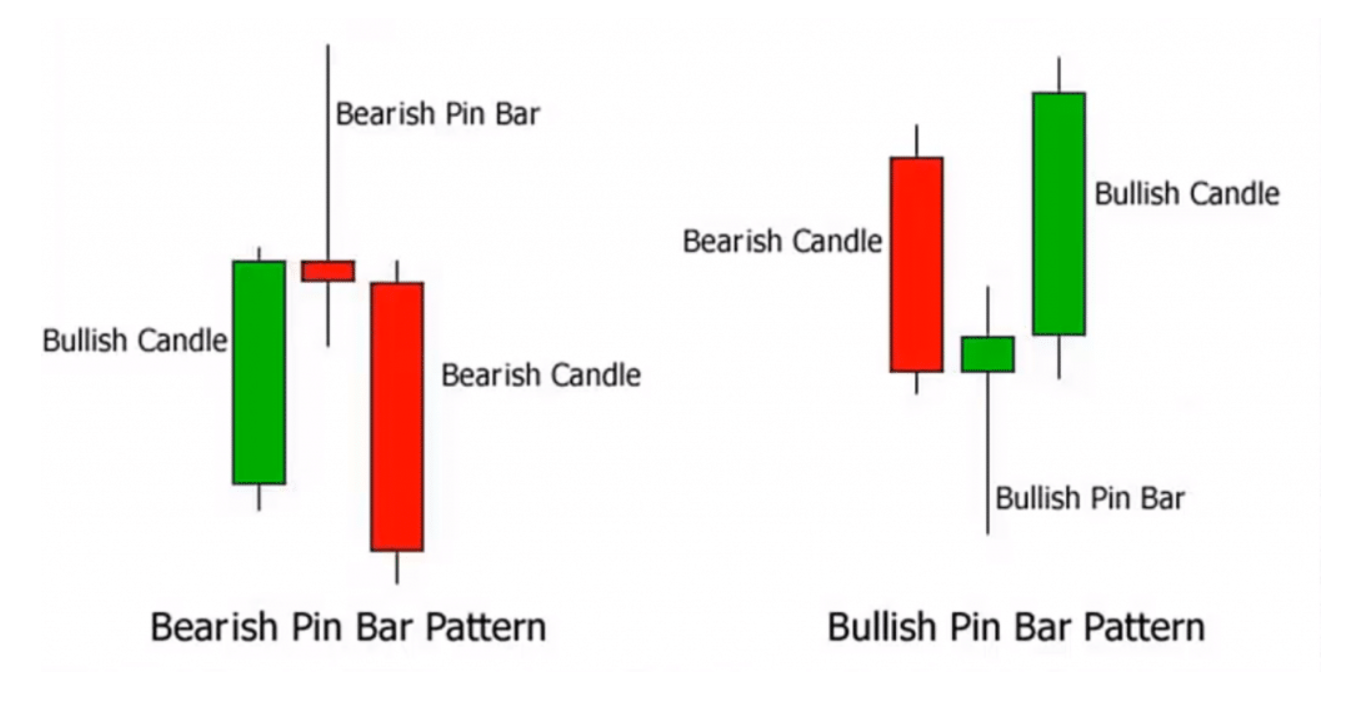
This is a one-candle pattern that is famous for catching trend reversals. It has a very small body and one extremely long wick. See the example below.
Bullish Pin Bar: A long wick at the bottom, indicating that sellers attempted to push the price down, but buyers strongly responded to push it back up.
Bearish Pin Bar: A long wick on the top. Buyers tried to push the price to the moon, but sellers forcefully slapped it back down.
3. The Three-Bar Continuation
Sometimes, you just want to ride the wave that is already moving. This pattern helps you jump into a strong trend safely.
Bullish Continuation: A large green candle, a small red candle (a tiny pause), and then another large green candle that closes higher than the pause. It means the uptrend is healthy and continuing.
4. The Three-Bar Reversal
This pattern is a highly accurate signal that a trend is dying and about to flip directions.
Bullish Reversal: A large red candle, a small red candle (the sellers are getting tired), and then a massive green candle that completely wipes out the previous moves.
5. Breakout Candles
When the market goes quiet and the price barely moves, it forms a series of very small candles (consolidation). A breakout happens when a giant, full-bodied candle suddenly smashes out of that quiet zone.
If a giant green candle breaks out of the quiet zone, expect the price to keep flying up.
6. Shrinking Candles
This is a brilliant pattern for spotting exhaustion in the market.
Imagine three red candles in a row, but each one gets smaller and smaller. This tells you the sellers are running out of steam. If a large green candle immediately follows, the buyers have taken the wheel, and a reversal is starting.
The Pro Strategy: Combining Patterns with Key Levels
Here is the secret that most beginners never learn: Do not trade these patterns floating in the middle of nowhere. If you see a beautiful Bullish Engulfing pattern, but it happens randomly in the middle of a chart, it might fail. To create a high-win-rate strategy, you must combine these patterns with Key Levels (areas where the price has reacted strongly in the past).
The 3-Step Execution Plan
Find the Key Level: Look at your 1-hour or 4-hour chart. Find a clear "floor" (Support) where the price has bounced up before, or a clear "ceiling" (Resistance) where the price has been rejected.
Wait for the Interaction: Be patient. Wait for the price to slowly come back to that floor or ceiling.
Look for the Pattern: This is the most important step. When the price touches your Key Level, do not just guess what will happen. Wait for one of our 6 candlestick patterns to form exactly on that line.
For example, if the price drops to a major support line and a massive bullish pin bar forms right on the line, you have a high-probability trade. You enter a buy order, place your stop loss safely below the long wick of the pin bar, and aim for a target that is at least twice your risk.
By combining structure (Key Levels) with momentum (Candlestick Patterns), you stop gambling and start trading like a professional.
To master profitable trading strategies with technical analysis, click here to download the Crypto Traders' Handbook and begin your journey.
Related Questions: