Cryptocurrency Trading Indicators 2026: 4 Beginner Tools
How to do cryptocurrency trading starts with reading charts. Learn four beginner indicators and the false signals each can produce.
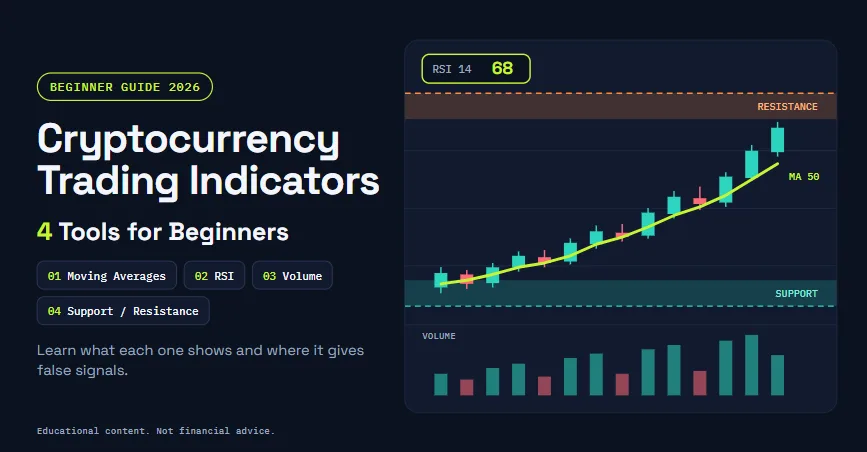
Cryptocurrency Trading Indicators in 2026: 4 Tools for Beginners
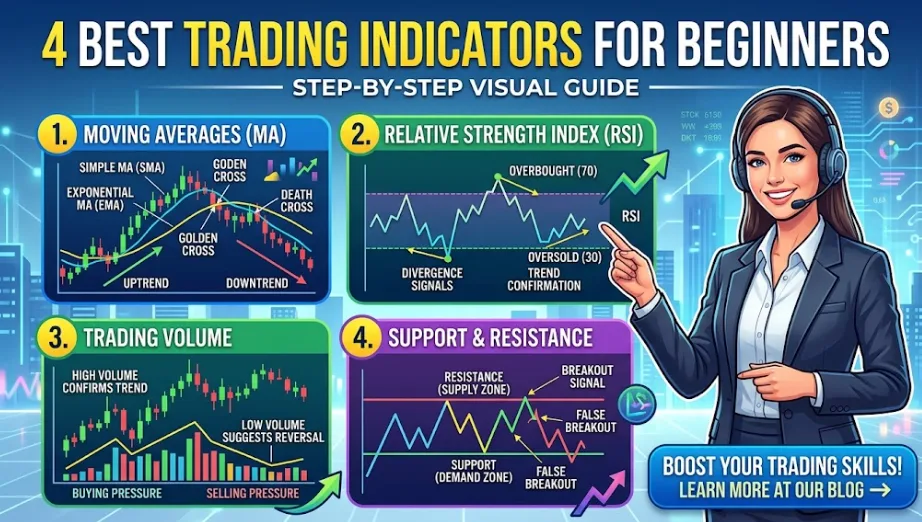
To start cryptocurrency trading with some structure and indicators, you need to learn to read a price chart first, then decide how much you can afford to lose before placing a trade. Here are four indicators I recommend for beginner traders: moving averages, the Relative Strength Index (RSI), trading volume, and support and resistance levels. The truth is, none of the trading indicators mentioned here can 100% predict where price goes next. They organize past price and volume so you can make rules instead of guesses. This guide explains what each one shows, how to read it, and how it can mislead you.
Here are the key takeaways from this post
- Learn to read a chart and set a maximum loss before you deposit money.
- Moving averages show trend, RSI shows momentum, volume shows participation, and support/resistance marks past reaction zones.
- Every indicator lags price and can give false signals, especially in sideways or news-driven markets.
- Combine tools that answer different questions, and test them on past charts first.
- No indicator predicts price or guarantees returns.
Before you use any indicator: know the risks
Indicators help you read market behavior, but they do not eliminate risk. Cryptocurrency markets trade 24 hours a day. Prices can move sharply on news, and exchange fees and spreads reduce the outcome of every trade. Some platforms offer leverage, which can magnify losses.
Before trading:
- Use only money you can afford to lose completely.
- Choose a platform that is permitted in your country and read its fee schedule.
- Check how your jurisdiction taxes crypto gains and what records you must keep.
- Practise on a demo account or by marking up historical charts.
The four indicators at a glance
1. Moving averages: read the trend
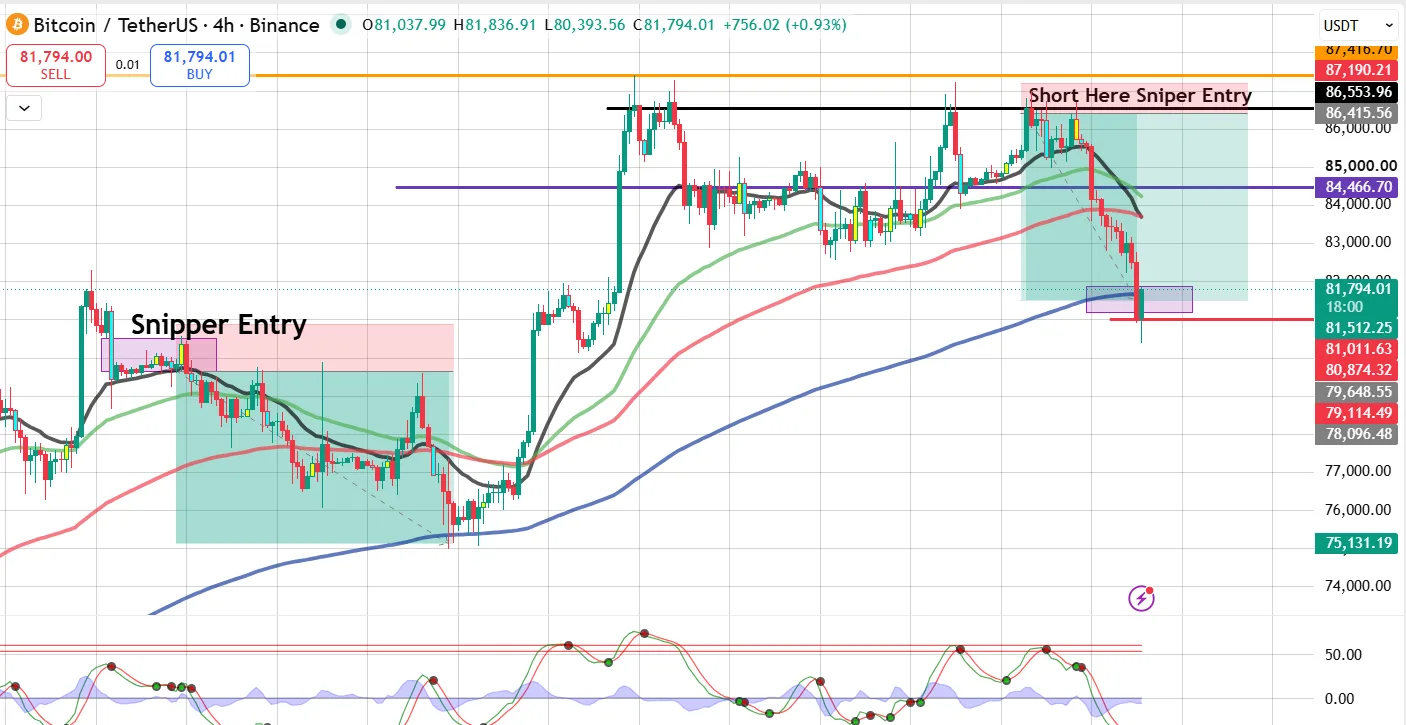
A moving average (MA) is the average closing price over a set number of periods, recalculated with each new candle. It smooths out noise, making the trend's direction easier to see. EMAs 20, 50, 100, and 200 are my favorite for analyzing the cryptocurrency market on the 4-hour interval. See an example below.
How to read it:
- Price above a rising MA suggests an uptrend. Price below a falling MA suggests a downtrend.
- Popular settings are the 50-period and 200-period MAs. When the shorter 50-period MA crosses above the longer one (200-period MA), traders call it a “golden cross”; the reverse is a “death cross”.
- Simple moving averages weight all periods equally. Exponential moving averages weight recent prices more, so they react faster.
False-signal risk: MAs lag price by design. In a sideways market, price crosses back and forth across the line, producing repeated losing signals. A cross often appears after much of the move has already occurred. You can learn more about EMA Trading Strategies in the Crypto Traders' Handbook.
2. RSI: check momentum
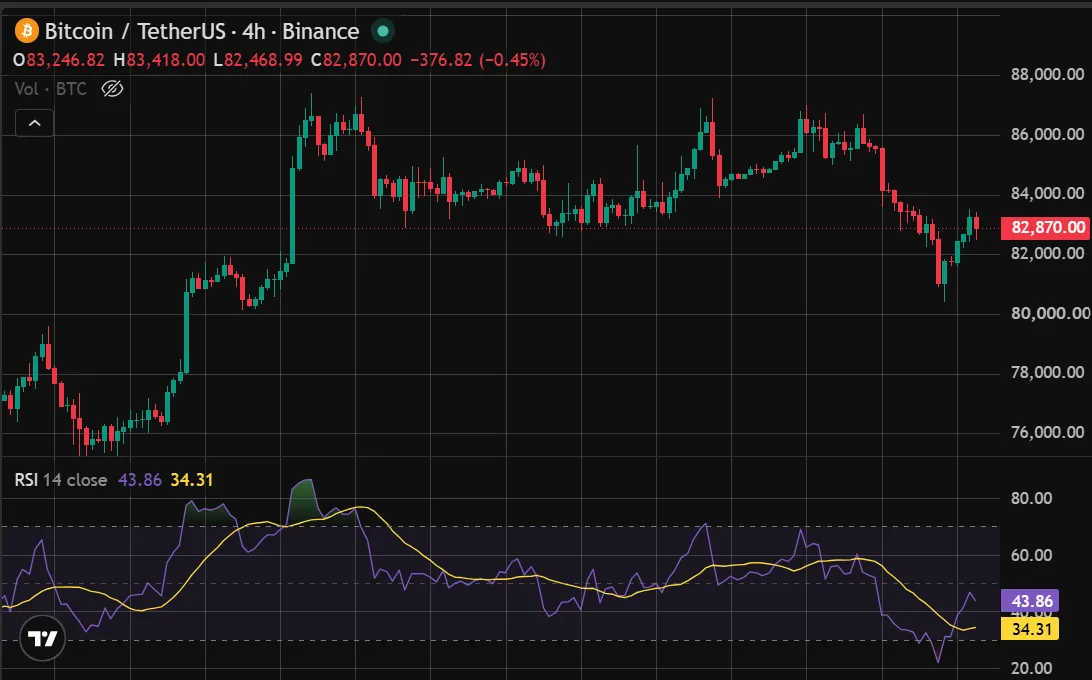
The Relative Strength Index measures the rate of recent price changes on a scale from 0 to 100. It was introduced by J. Welles Wilder, and the default setting on most charting platforms is 14 periods.
How to read it:
- A reading above 70 is commonly considered overbought, and below 30 is considered oversold.
- Divergence is a second use. If price makes a new high but RSI does not, momentum may be weakening.
False-signal risk: Overbought does not mean “sell.” In strong trends, RSI can remain above 70 for extended periods, and acting on the first reading can mean exiting too early or shorting into strength. RSI works best as a caution flag alongside trend and volume.
3. Volume: see who is participating
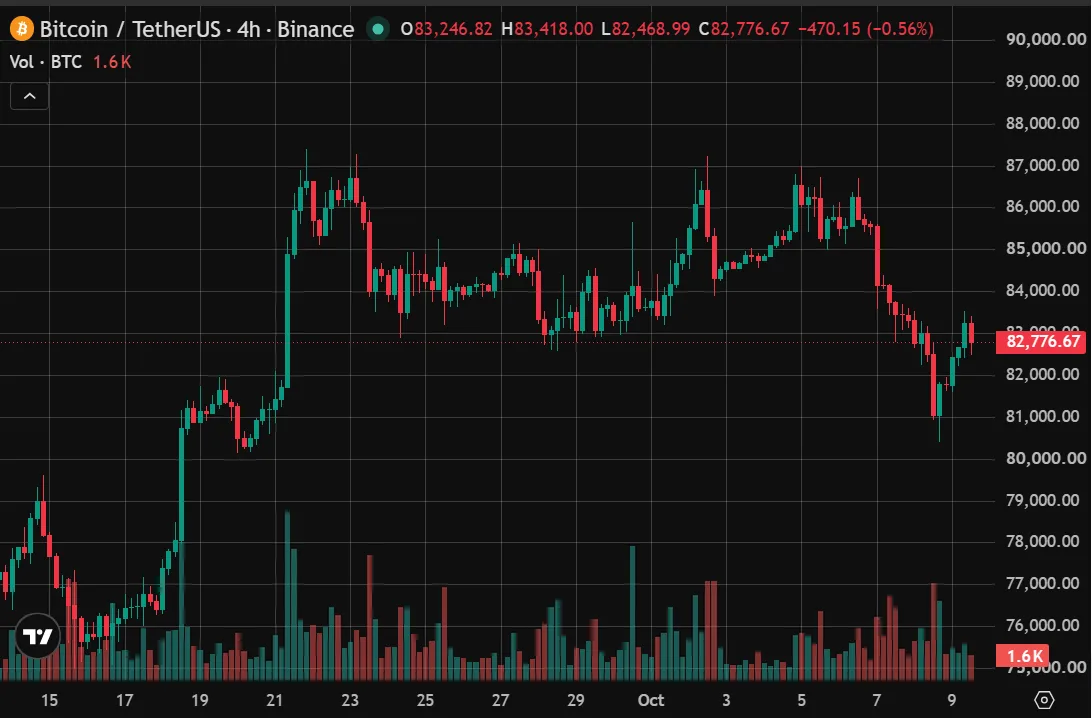
Volume is the amount of an asset traded during each candle, usually shown as bars under the chart.
How to read it:
- A price move on rising volume suggests wider participation than a move on thin volume.
- A breakout above resistance backed by high volume is generally treated as more convincing than one on low volume.
- Falling volume during a rally can hint that interest is fading.
False-signal risk: Volume differs between exchanges, so a single exchange’s chart may not show the whole market. News events can create spikes that reverse quickly. Some reported volume in crypto may be inflated or low quality, so compare more than one reputable source [VERIFY with a primary data source before publishing any specific claim].
4. Support and resistance: mark the zones
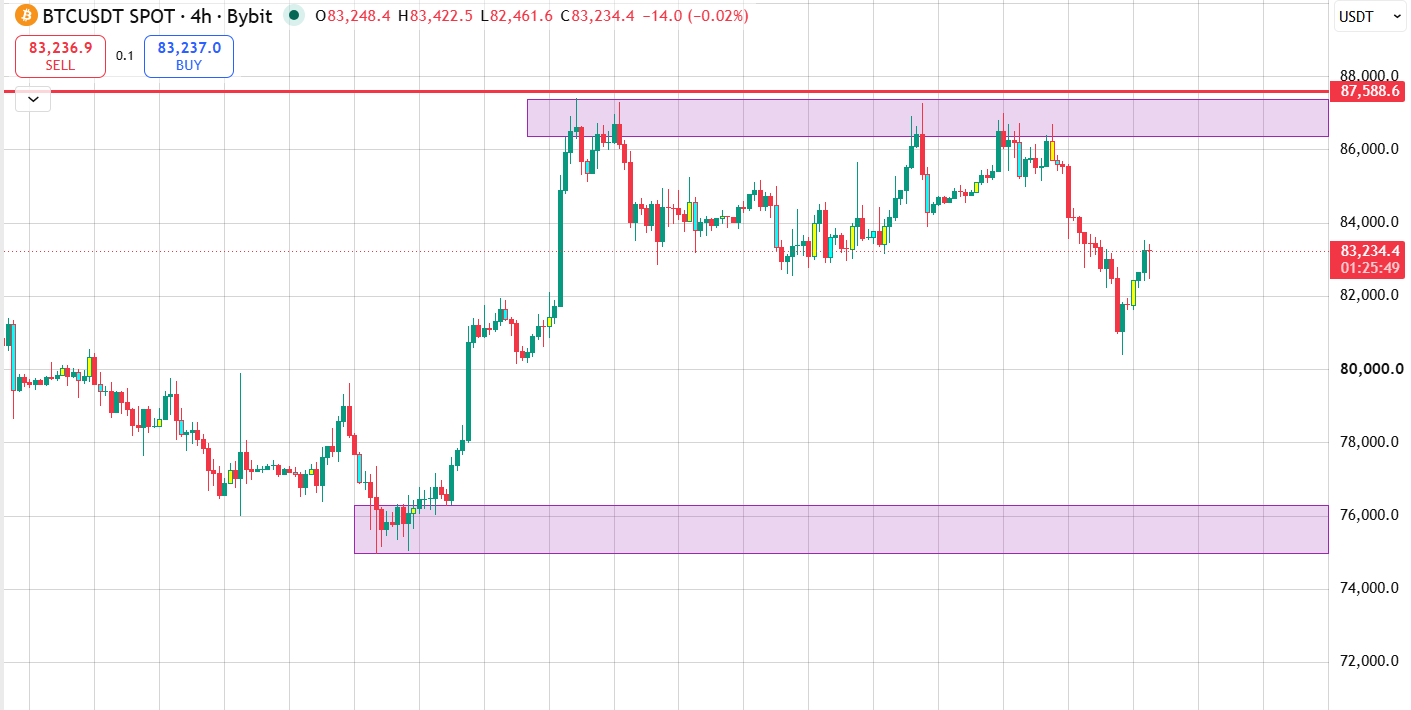
Support is a price area where falling prices have previously paused or reversed. Resistance is an area where rising prices have previously stalled. See an example of support and resistance zones on the BTC/USD 4-hour chart below.
How to draw them:
- Zoom out to a 4-hour or daily chart.
- Mark price areas where the chart turned at least two or three times.
- Draw zones, not single lines; price rarely reacts at an exact number.
- Note round numbers and prior highs and lows, which many traders watch.
False-signal risk: Levels are subjective, so two traders may draw different ones. A level that has held several times can still break, and broken support often becomes resistance. Wait for a candle to close beyond a level before treating the break as real, and expect some breaks to reverse.
How to combine the four indicators
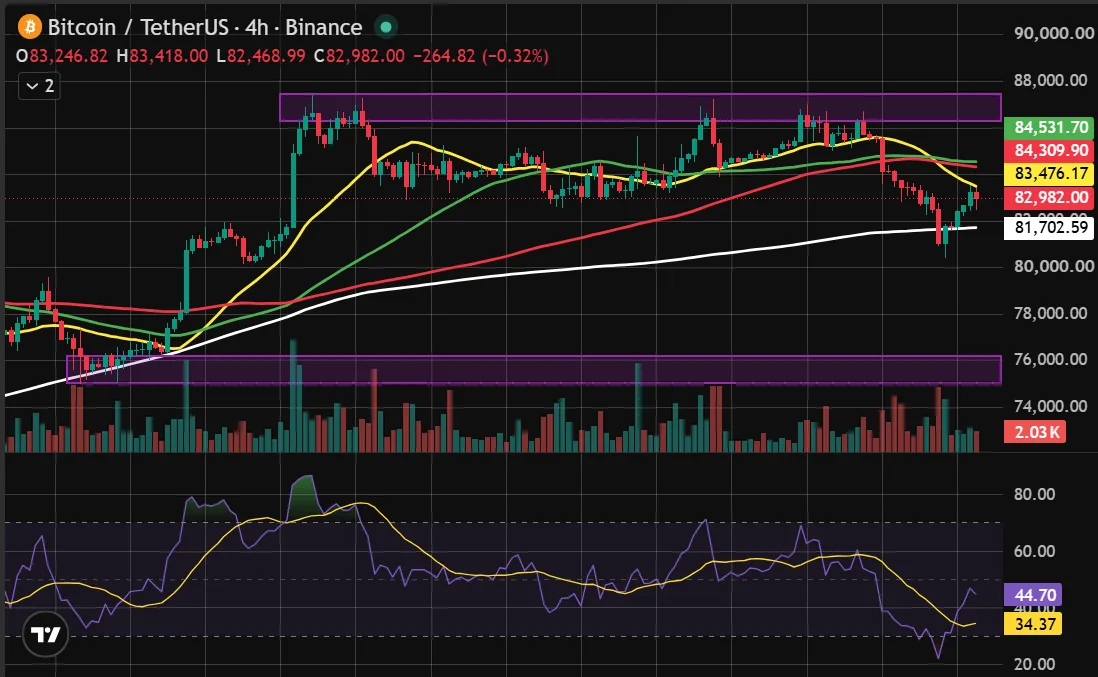
If you're asking how to start crypto trading with indicators, use a repeatable routine rather than reacting to each candle. The chart below shows all four trading indicators mentioned in this post. You don't need all of them to become a profitable trader. Understanding how to identify and draw strong support and resistance zones, plus how to read the EMA ribbon, puts you ahead of other traders who rely on complex trading tools. Master crypto trading and technical analysis by practicing the lessons in the Crypto Traders' Handbook.
- Pick the timeframe. Start with the daily chart for context, then check a shorter one if you want a more precise entry.
- Identify the trend with a 50- and 200-period moving average.
- Mark support and resistance zones on the higher timeframe.
- Check RSI for stretched momentum or divergence near those zones.
- Check volume to see whether a move or breakout has participation.
- Write the plan before trading: entry idea, where you would exit if wrong, and the maximum amount you will risk.
- Log the result, including trades that lost, and review it after a set number of trades.
Combine indicators that answer different questions. Using three momentum tools together provides confirmation of the same information, not new information.
Worked example (for illustration only)
In the example below, you can clearly see that BTC/USD is trading below a strong resistance zone on the 4-hour chart. However, the 200-period EMA (white line) recently provided support during a correction, while the 20-, 50-, and 100-period EMAs are acting as overhead resistance. In this case, you either wait for the price to break above those EMAs before buying or entering a long position, or wait for the price to fall below the 200-period EMA before selling or shorting the market.
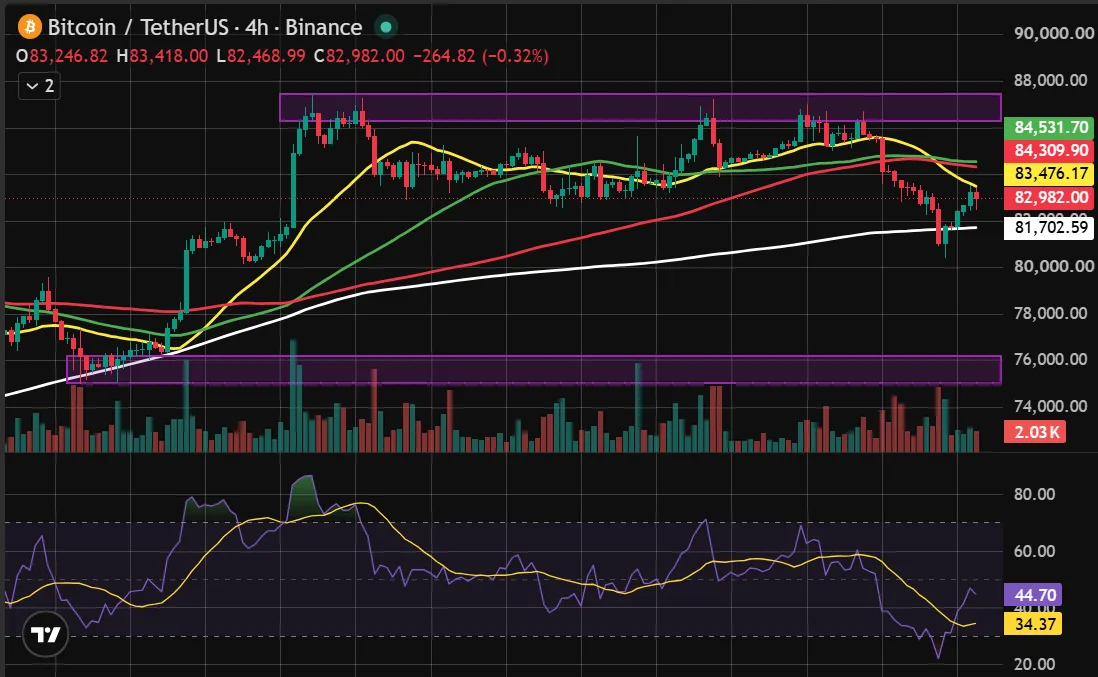
A cautious reading suggests the trend is up, but the move toward resistance lacks confirmation, so the trader waits. A plan might read: “Act only if a daily candle closes above the zone with higher volume; exit if price closes back below it.” The point is the written rule, not a prediction.
Common technical traps
- Indicator stacking: Adding more indicators rarely adds information; it often adds confusion.
- Curve fitting: Changing settings until they fit past data does not mean they work going forward.
- Ignoring the bigger trend: A signal against the higher-timeframe trend is lower quality.
- Trading news with chart tools: Sudden announcements, hacks and regulatory headlines can override any indicator.
- No exit rule: An entry signal without a defined exit is a hope, not a plan.
- Overtrading: More trades mean more fees and more chances to make emotional errors.
Pre-trade checklist
- I know the maximum amount I will lose on this trade.
- I have checked the trend on a higher timeframe.
- I have marked nearby support and resistance.
- I have checked RSI and volume and understand their false-signal risks.
- I know the fees and whether leverage is involved.
- I have written my exit before entering.
9. FAQ
How do I start crypto trading as a beginner?
Start by learning, not by depositing. Practice reading charts on a free platform or demo account, then choose a regulated exchange available in your country and complete its identity verification. Decide your maximum loss per trade in advance, start with an amount you can afford to lose entirely, and check fees and local tax rules first. Master crypto trading and technical analysis by practicing the lessons in the Crypto Traders' Handbook.
What tools do I need for crypto trading?
At a minimum, you need an exchange account, a charting platform with indicators such as moving averages, RSI, and volume, and a trade log. Many exchanges include basic charts. Consider price alerts and a secure wallet for coins you are not actively trading. Tools organize information; they do not predict price.
Which indicator is best for beginners?
No single indicator is best. Moving averages show trend, RSI shows momentum, volume shows participation, and support and resistance mark reaction zones. Beginners usually do better by combining two or three indicators that answer different questions than by stacking several that measure the same thing. Test any combination on past charts before risking money.
Are crypto trading indicators reliable?
Not on their own. Indicators summarize past price and volume, so they lag and generate false signals, especially in sideways or news-driven markets. Treat them as context for a plan with defined entries, exits, and risk limits. Expect losing trades even when you follow your rules, and never treat a signal as a promise.
Can you make money trading crypto?
Some people profit, but many retail traders lose money, and no indicator guarantees returns. Prices are volatile, fees and spreads erode returns, and leverage can magnify losses on some platforms. Check regulator warnings and your local tax rules before trading, and never trade with money you need for essentials. Master crypto trading and technical analysis by practicing the lessons in the Crypto Traders' Handbook.
Thanks for reading.
P.S. Need More Help and Resources?
Buy and sell crypto on Bybit, my preferred crypto exchange.
Download the Crypto Traders’ Handbook
Download Your AltSeason Blueprint
Upgrade Your Subscription to receive a copy of the BTM user’s guide.
Related Articles:
How to start cryptocurrency trading and investing for beginners
Understanding key differences between Bitcoin and Cryptocurrency