Bitcoin Tops $87K After Jobs Miss: Uptober Rally Explained
Bitcoin broke $86K resistance after a weak jobs report cut Fed hike odds to 13%. Here's what's driving the rally, and the levels to watch next.
Bitcoin Tops $87K After a Big Jobs Miss: What's Driving "Uptober"
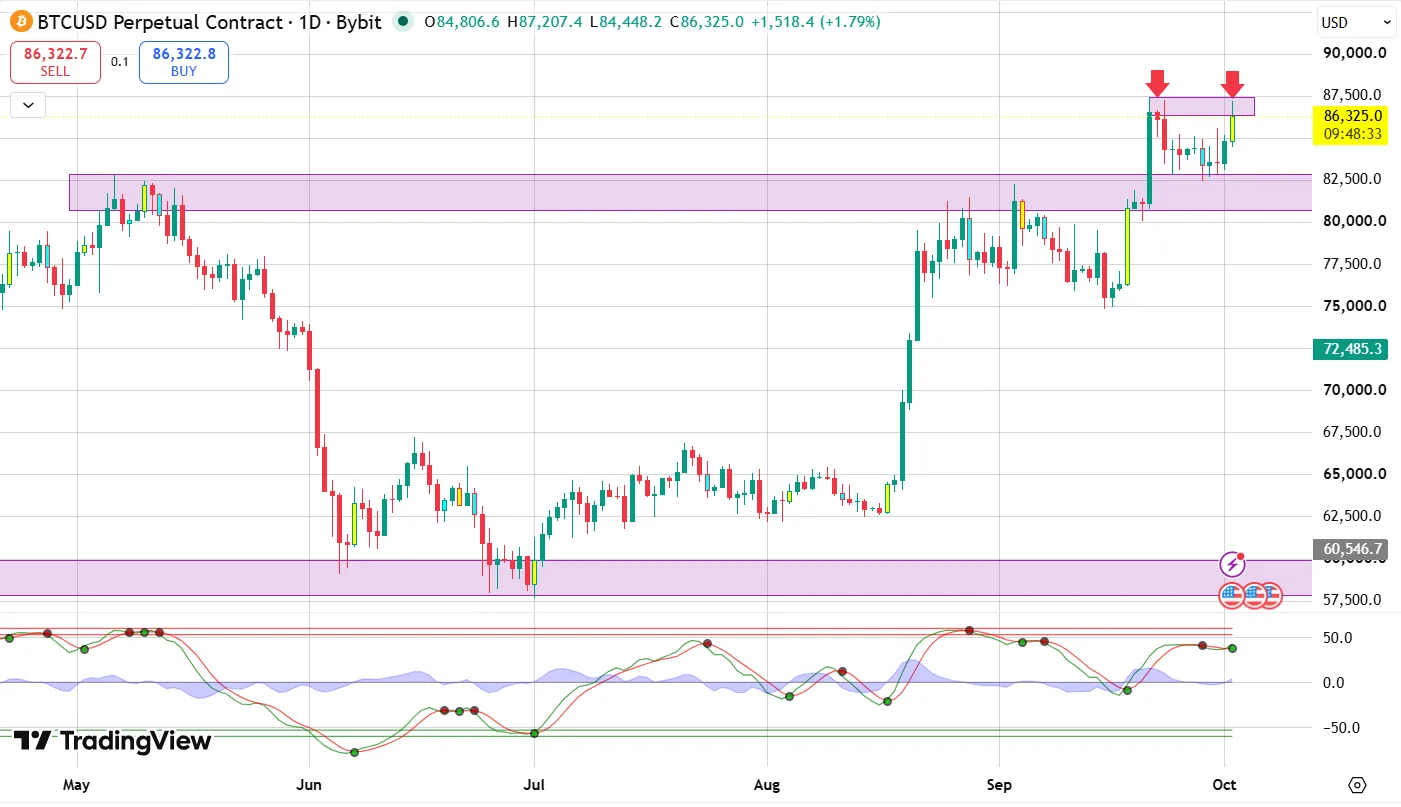
Bitcoin broke through resistance near $86,000 and reached its highest level since September 23 after U.S. payrolls data came in far weaker than expected, sending October rate-hike odds down to nearly nothing. The crypto market followed suit, and traders are acting as if risk is back on the table.
Key takeaways
- September payrolls came in at just 29,000, against a forecast of 90,000.
- The odds of an October Fed hike collapsed to 13%, from 70% a few days earlier.
- Bitcoin broke a wall of sell orders near $85,000 and traded above $86,800.
- Bitcoin's market dominance is closing in on 60%, a sign traders are rotating into risk.
- Spot Bitcoin ETFs returned to inflows after their strongest quarter of 2026.
Why did Bitcoin jump after the jobs report?
Because the report was bad enough to change the Fed's math.
The U.S. economy added just 29,000 jobs in September, well below the 90,000 consensus forecast. August's gain was revised down to 133,000 from an original 162,000. July's number was revised from a 21,000 gain to a 10,000 loss. The unemployment rate rose to 4.2%, above both the forecast and August's reading. Average hourly earnings rose just 0.1% on the month, well under the 0.3% expected.
Markets had already been leaning dovish. CME FedWatch showed roughly 70% odds of an October hike earlier in the week, but dovish comments from New York Fed President John Williams and Fed Vice Chair Philip Jefferson pulled that down to about 25% by Friday morning. Weak jobs data then pushed the odds to just 13%. Odds of no hike for the rest of 2026 rose to 25%, up from under 10% earlier in the week.
Bitcoin was already trading above $86,000 ahead of the release and continued to climb afterward. The 10-year Treasury yield fell 7 basis points to 5.17%, the 2-year yield fell a similar amount to 4.71%, gold gained more than 1%, and the dollar weakened against major currencies. Oil also fell more than 3%.
Matt Mena, senior crypto research strategist at 21Shares, said the weaker data could help bitcoin clear $87,000, a level that had capped the price for much of the year. If that resistance breaks, $90,000 and then $97,000 would be the next levels.
How did Bitcoin break through resistance near $85,000?
Through an order-book fight that buyers won.
A concentration of sell orders around $85,000 kept Bitcoin rangebound for most of the week, according to on-chain analytics firm Glassnode. On Friday, buyers broke through that barrier, and bitcoin reached $86,857 on Bitstamp before pulling back slightly. Glassnode noted that with reduced sell-side liquidity above, "this should allow price to move up faster."
This wasn't the first time this week that order-book liquidity moved the market. Earlier, more than $30 million in sell orders had appeared around $85,700, briefly capping gains. Once those orders cleared, CoinGlass data showed a new cluster of potential liquidations forming above $87,300, indicating that the next resistance zone is already visible on exchange heatmaps.
The move also triggered a wave of short covering. BTC short liquidations totaled $122 million over 24 hours, while the cross-crypto total reached $210 million.
Register a FREE trading account on Bybit to claim your bonus
Is the broader market turning risk-on?
The signals point that way.
Bitcoin's dominance, its share of the total crypto market, is approaching 60%, while USDT, the largest stablecoin, slipped to about 6.3%. CoinDesk reads that combination as traders moving out of cash and into tokens.
Data backs it up. Bitcoin futures open interest rose to $22.4 billion from $20.9 billion a day earlier, and funding rates spiked on some venues, with annualized rates at 9–10% on Hyperliquid and OKX. Options flow remained heavily tilted toward calls, with the 24-hour put/call ratio at 88% in favor of calls. That combination, rising open interest alongside firmer funding, typically indicates traders are adding leveraged long positions rather than closing out old ones.
It isn't one-directional, though. CoinGlass data showed $344 million in 24-hour liquidations, up sharply from $100 million the day before, with roughly 28% longs and 72% shorts. A Binance liquidation heatmap flagged $87,400 as a level to watch if the price keeps climbing. Altcoins outside the top names moved even more: SKY, AAVE and APT jumped 7–10%, while QNT, which had more than tripled over the prior week, gave back about 15% on profit-taking.
P.S.: Claim your trading bonus on Bybit, my favorite cryptocurrency exchange.
Are ETF investors buying the rally?
Yes, though more cautiously than during September's peak.
Bitcoin ETFs flipped back to inflows on October 1, recording $102.7 million, after a $148.7 million outflow the day before. BlackRock's IBIT alone attracted $195 million, while outflows from several smaller funds trimmed the overall total. That followed a strong third quarter: $6.34 billion in net inflows, including $2.65 billion in September, while bitcoin itself rose nearly 43% over the quarter.
Glassnode's read is fair: daily flows have cooled sharply since September 21, when the tally hit an 11-month high of $999 million. "The funds are still buying, but at a small fraction of the pace of those two days," the firm wrote, adding that a return to that pace would be the clearest sign of renewed ETF demand.
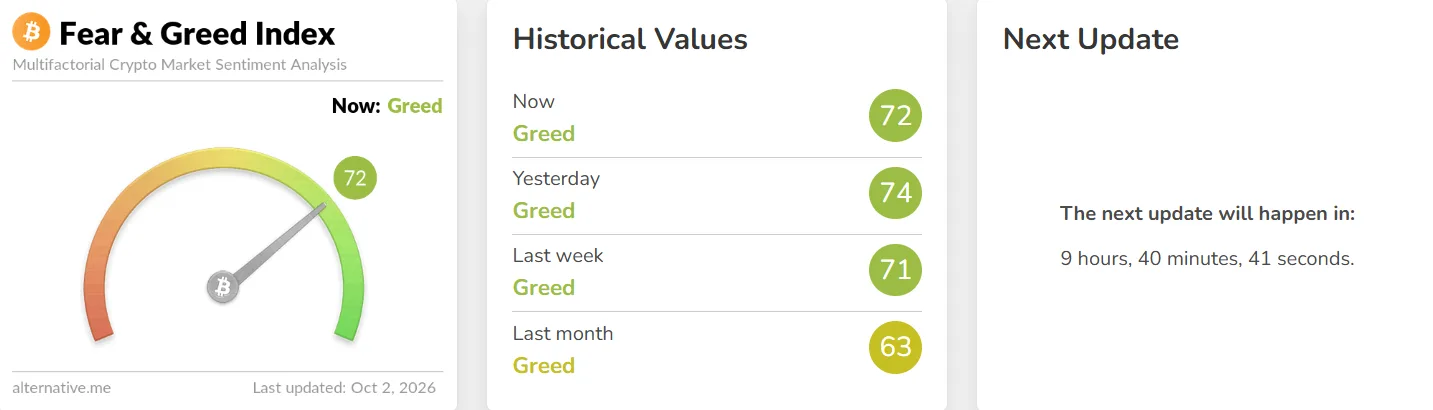
Sentiment has eased slightly too. The Crypto Fear & Greed Index sat at 72, down from 74 the day before, though still in "Greed" territory. See the screenshot below.
What should you watch next?
- Inflation data: September's CPI report, due October 14, is the next major input for Fed odds. CoinDesk notes one portfolio manager is using a 10-year real yield of about 3% as a line in the sand, above which a retest of $80,000–$82,000 becomes more likely than a push to $90,000.
- ETF flow pace: A sustained return to the $900 million-plus daily inflows seen on September 19–21 would be a stronger bullish signal than the current slower pace.
- The $87,300 liquidation cluster: This is the next resistance zone flagged by CoinGlass data.
- Bitcoin dominance: A continued climb toward 60% would reinforce the risk-on narrative; a reversal would suggest the rotation is stalling.
- European bond spreads: The French-German 10-year yield spread has widened to 152 basis points, approaching levels last seen in the 2011 European debt crisis, a tail risk worth tracking even though it isn't a crypto story directly.
FAQ
Why is Bitcoin rising after a weak jobs report?
A soft labor market reduces the odds the Fed hikes rates, which tends to support risk assets. September payrolls came in at 29,000 versus a 90,000 forecast, and October hike odds fell to about 13%.
What is Bitcoin's next resistance level?
CoinGlass data shows a cluster of potential liquidations building above $87,300. Beyond that, analysts have flagged $90,000 and $97,000 as the next levels if $87,000 clears.
Are Bitcoin ETFs still seeing inflows?
Yes, though the pace has slowed. Bitcoin ETFs took in $102.7 million on October 1, down sharply from the near-$1 billion days in late September.
What is Bitcoin dominance and why does it matter?
It's Bitcoin's share of the total crypto market. Dominance near 60%, alongside a falling stablecoin share, suggests traders are moving money out of cash and into crypto.
The bottom line
A weak jobs report did what months of chatter about rate cuts couldn't: it pulled October hike odds down to near zero and gave bitcoin room to break through multi-week resistance. The rally has real legs. Order-book buyers have overwhelmed sellers, leverage is building, and dominance is rising, but the next test is whether ETF inflows and upcoming inflation data confirm this. The $87,300 zone is the first to watch.
The cycle rewards preparation and punishes hesitation at the exact moment conviction matters most. Do you want a blueprint to get started as the crypto bull market heats up?
[Get the Golden Buy Zone Blueprint here]
[Subscribe to our newsletter to receive weekly market reports and altcoin reviews]
Visit Bybit to buy the meme coins listed above before they go explosive.
Sources
- CoinDesk, Crypto traders are in risk-on mode as bitcoin (BTC) dominance nears return to 60% (Omkar Godbole)
- CoinDesk, Live updates: Bitcoin trading near $87,000 after big miss on U.S. jobs (James Van Straten and Helene Braun)
- Cointelegraph, Bitcoin reaches for $87K as short liquidations top $120M (William Suberg)
- Cointelegraph, Bitcoin ETFs kick off 'Uptober' with $103M inflow (Helen Partz)
This article is informational only. Do your own research before making financial decisions.